| Red | Green | Blue | |
| z | 17.64 | ||
| znorm | Inf | ||
| sky | -Inf | -Inf | -Inf |
| S/N | 27.9 | 47.8 | 51.9 |
| S/N(c) | 0.0 | 0.0 | 0.0 |
| SN(E/C) |


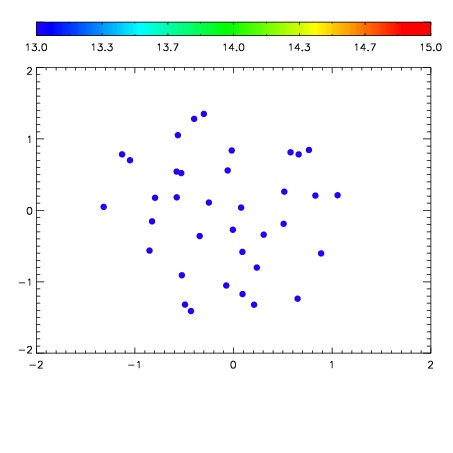

| Frame | Nreads | Zeropoints | Mag plots | Spatial mag deviation | Spatial sky 16325A emission deviations (filled: sky, open: star) | Spatial sky continuum emission | Spatial sky telluric CO2 absorption deviations (filled: H < 10) | |||||||||||||||||||||||
| 0 | 0 |
|
|
|
|
|
|
| IPAIR | NAME | SHIFT | NEWSHIFT | S/N | NAME | SHIFT | NEWSHIFT | S/N |
| 0 | 06100041 | 0.490276 | 0.00000 | 19.1464 | 06100040 | 0.00129873 | 0.488977 | 19.1254 |
| 1 | 06100042 | 0.489655 | 0.000621021 | 19.1685 | 06100039 | 0.00258653 | 0.487689 | 19.1274 |
| 2 | 06100038 | 0.487459 | 0.00281700 | 19.0715 | 06100043 | -0.000320049 | 0.490596 | 19.1215 |
| 3 | 06100037 | 0.486663 | 0.00361300 | 19.0344 | 06100036 | 0.00000 | 0.490276 | 18.9719 |