| Red | Green | Blue | |
| z | 17.64 | ||
| znorm | Inf | ||
| sky | -Inf | -Inf | -NaN |
| S/N | 23.8 | 41.6 | 45.7 |
| S/N(c) | 0.0 | 0.0 | 0.0 |
| SN(E/C) |
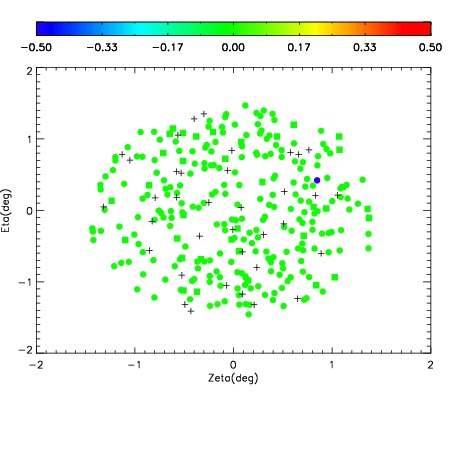
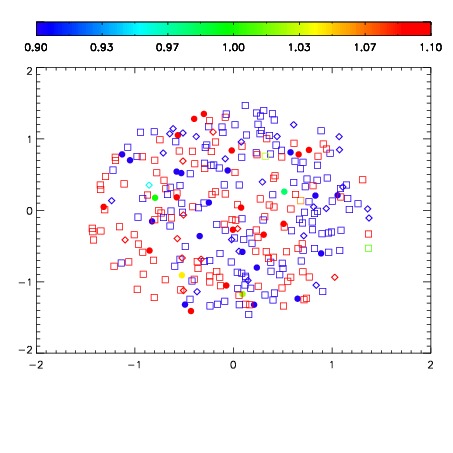


| Frame | Nreads | Zeropoints | Mag plots | Spatial mag deviation | Spatial sky 16325A emission deviations (filled: sky, open: star) | Spatial sky continuum emission | Spatial sky telluric CO2 absorption deviations (filled: H < 10) | |||||||||||||||||||||||
| 0 | 0 |
|
|
|
|
|
|
| IPAIR | NAME | SHIFT | NEWSHIFT | S/N | NAME | SHIFT | NEWSHIFT | S/N |
| 0 | 06420028 | 0.488403 | 0.00000 | 18.8257 | 06420029 | 0.00316362 | 0.485239 | 18.5247 |
| 1 | 06420024 | 0.483676 | 0.00472701 | 18.8820 | 06420022 | 0.00000 | 0.488403 | 19.0649 |
| 2 | 06420027 | 0.487901 | 0.000501990 | 18.8751 | 06420026 | 0.00276699 | 0.485636 | 18.7333 |
| 3 | 06420023 | 0.483269 | 0.00513399 | 18.8729 | 06420025 | 0.00230288 | 0.486100 | 18.6797 |