| Red | Green | Blue | |
| z | 17.63 | ||
| znorm | Inf | ||
| sky | -NaN | -NaN | -Inf |
| S/N | 21.8 | 36.8 | 40.0 |
| S/N(c) | 0.0 | 0.0 | 0.0 |
| SN(E/C) |
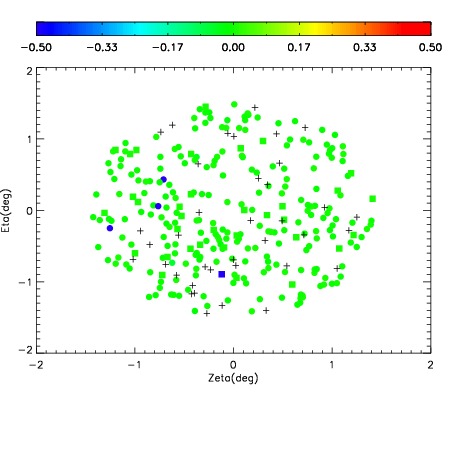
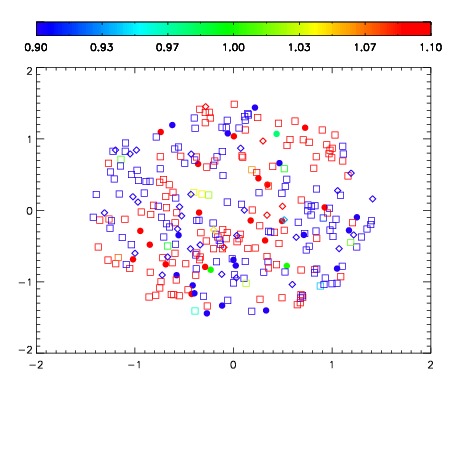
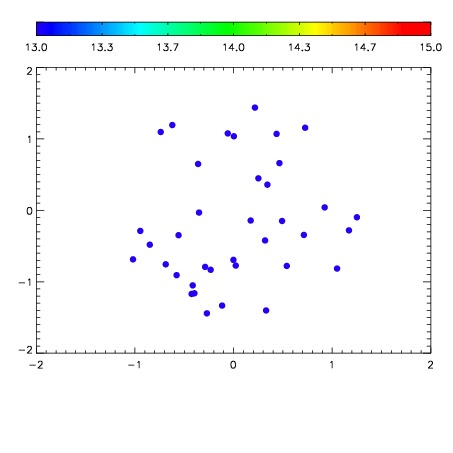

| Frame | Nreads | Zeropoints | Mag plots | Spatial mag deviation | Spatial sky 16325A emission deviations (filled: sky, open: star) | Spatial sky continuum emission | Spatial sky telluric CO2 absorption deviations (filled: H < 10) | |||||||||||||||||||||||
| 0 | 0 |
|
|
|
|
|
|
| IPAIR | NAME | SHIFT | NEWSHIFT | S/N | NAME | SHIFT | NEWSHIFT | S/N |
| 0 | 02830041 | 0.413496 | 0.00000 | 19.0051 | 02830042 | 0.00431405 | 0.409182 | 18.9286 |
| 1 | 02830040 | 0.412740 | 0.000755996 | 18.9678 | 02830039 | 3.08314e-05 | 0.413465 | 18.9142 |
| 2 | 02830037 | 0.413494 | 1.99676e-06 | 18.9103 | 02830038 | 0.00354371 | 0.409952 | 18.9095 |
| 3 | 02830036 | 0.411739 | 0.00175700 | 18.7771 | 02830035 | 0.00000 | 0.413496 | 18.7147 |