| Red | Green | Blue | |
| z | 17.63 | ||
| znorm | Inf | ||
| sky | -NaN | -NaN | -Inf |
| S/N | 25.7 | 44.6 | 48.4 |
| S/N(c) | 0.0 | 0.0 | 0.0 |
| SN(E/C) |
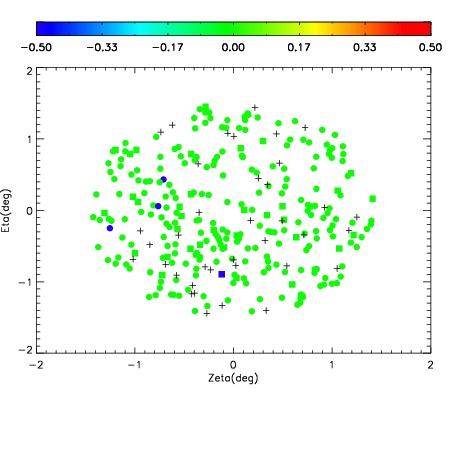
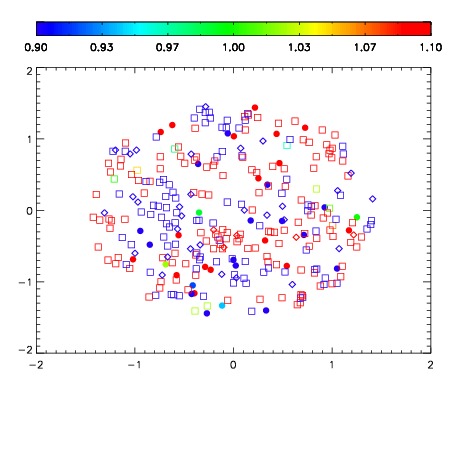


| Frame | Nreads | Zeropoints | Mag plots | Spatial mag deviation | Spatial sky 16325A emission deviations (filled: sky, open: star) | Spatial sky continuum emission | Spatial sky telluric CO2 absorption deviations (filled: H < 10) | |||||||||||||||||||||||
| 0 | 0 |
|
|
|
|
|
|
| IPAIR | NAME | SHIFT | NEWSHIFT | S/N | NAME | SHIFT | NEWSHIFT | S/N |
| 0 | 02860048 | 0.412570 | 0.00000 | 19.1723 | 02860049 | 0.00155430 | 0.411016 | 19.1783 |
| 1 | 02860047 | 0.411969 | 0.000600994 | 19.1571 | 02860042 | 0.00000 | 0.412570 | 19.1368 |
| 2 | 02860043 | 0.411295 | 0.00127500 | 19.1541 | 02860045 | 0.00392128 | 0.408649 | 19.1349 |
| 3 | 02860044 | 0.411870 | 0.000699997 | 19.1537 | 02860046 | 0.00131053 | 0.411259 | 19.1159 |