| Red | Green | Blue | |
| z | 17.63 | ||
| znorm | Inf | ||
| sky | -NaN | -NaN | -NaN |
| S/N | 25.2 | 43.1 | 45.8 |
| S/N(c) | 0.0 | 0.0 | 0.0 |
| SN(E/C) |
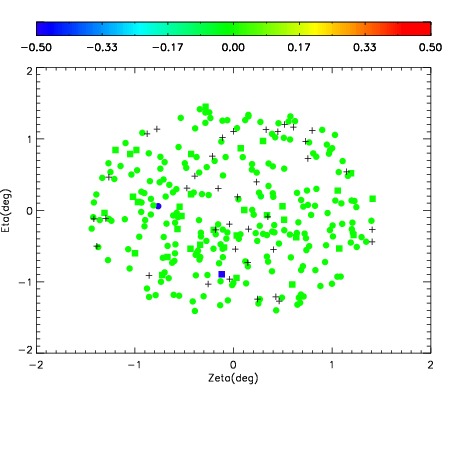
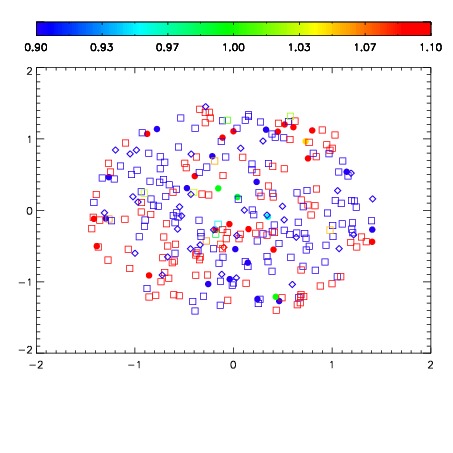


| Frame | Nreads | Zeropoints | Mag plots | Spatial mag deviation | Spatial sky 16325A emission deviations (filled: sky, open: star) | Spatial sky continuum emission | Spatial sky telluric CO2 absorption deviations (filled: H < 10) | |||||||||||||||||||||||
| 0 | 0 |
|
|
|
|
|
|
| IPAIR | NAME | SHIFT | NEWSHIFT | S/N | NAME | SHIFT | NEWSHIFT | S/N |
| 0 | 02610045 | 0.425742 | 0.00000 | 19.0871 | 02610046 | 8.99853e-05 | 0.425652 | 18.8638 |
| 1 | 02610041 | 0.425612 | 0.000129998 | 19.1470 | 02610039 | 0.00000 | 0.425742 | 19.0937 |
| 2 | 02610044 | 0.424840 | 0.000901997 | 19.1158 | 02610043 | -0.00221416 | 0.427956 | 19.0070 |
| 3 | 02610040 | 0.425518 | 0.000223994 | 19.0908 | 02610042 | 0.000773162 | 0.424969 | 18.8992 |