| Red | Green | Blue | |
| z | 17.64 | ||
| znorm | Inf | ||
| sky | -Inf | -Inf | -Inf |
| S/N | 27.0 | 46.6 | 48.3 |
| S/N(c) | 0.0 | 0.0 | 0.0 |
| SN(E/C) |

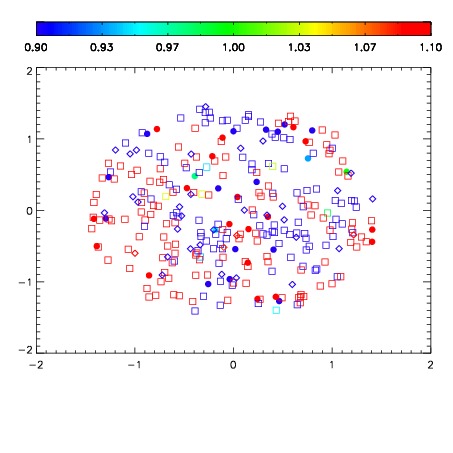
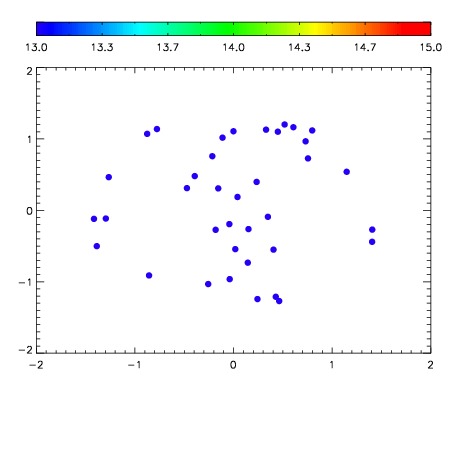

| Frame | Nreads | Zeropoints | Mag plots | Spatial mag deviation | Spatial sky 16325A emission deviations (filled: sky, open: star) | Spatial sky continuum emission | Spatial sky telluric CO2 absorption deviations (filled: H < 10) | |||||||||||||||||||||||
| 0 | 0 |
|
|
|
|
|
|
| IPAIR | NAME | SHIFT | NEWSHIFT | S/N | NAME | SHIFT | NEWSHIFT | S/N |
| 0 | 02890040 | 0.402324 | 0.00000 | 19.1169 | 02890042 | -0.00483218 | 0.407156 | 19.1504 |
| 1 | 02890044 | 0.399846 | 0.00247800 | 19.1276 | 02890041 | 2.43653e-05 | 0.402300 | 19.1539 |
| 2 | 02890043 | 0.398886 | 0.00343800 | 19.0971 | 02890038 | 0.00000 | 0.402324 | 19.1059 |
| 3 | 02890039 | 0.400532 | 0.00179198 | 19.0942 | 02890045 | -0.00116753 | 0.403492 | 19.0887 |