| Red | Green | Blue | |
| z | 17.63 | ||
| znorm | Inf | ||
| sky | -NaN | -NaN | -Inf |
| S/N | 28.1 | 48.1 | 50.1 |
| S/N(c) | 0.0 | 0.0 | 0.0 |
| SN(E/C) |


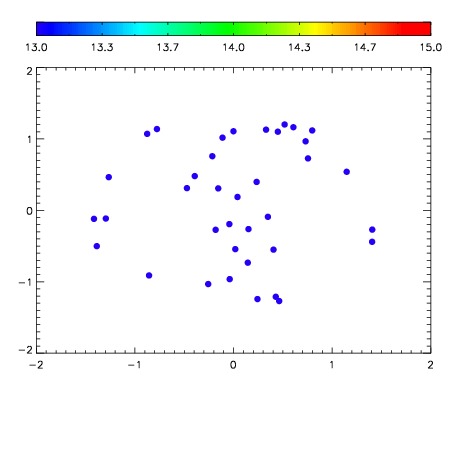

| Frame | Nreads | Zeropoints | Mag plots | Spatial mag deviation | Spatial sky 16325A emission deviations (filled: sky, open: star) | Spatial sky continuum emission | Spatial sky telluric CO2 absorption deviations (filled: H < 10) | |||||||||||||||||||||||
| 0 | 0 |
|
|
|
|
|
|
| IPAIR | NAME | SHIFT | NEWSHIFT | S/N | NAME | SHIFT | NEWSHIFT | S/N |
| 0 | 03040025 | 0.496284 | 0.00000 | 19.1462 | 03040027 | -0.00223747 | 0.498521 | 19.1437 |
| 1 | 03040029 | 0.496188 | 9.59933e-05 | 19.1874 | 03040030 | -0.000181328 | 0.496465 | 19.1798 |
| 2 | 03040028 | 0.495920 | 0.000364006 | 19.1538 | 03040026 | -0.00157905 | 0.497863 | 19.1468 |
| 3 | 03040024 | 0.495429 | 0.000854999 | 19.0756 | 03040023 | 0.00000 | 0.496284 | 18.9940 |