| Red | Green | Blue | |
| z | 17.64 | ||
| znorm | Inf | ||
| sky | -Inf | -Inf | -Inf |
| S/N | 27.6 | 47.5 | 50.1 |
| S/N(c) | 0.0 | 0.0 | 0.0 |
| SN(E/C) |


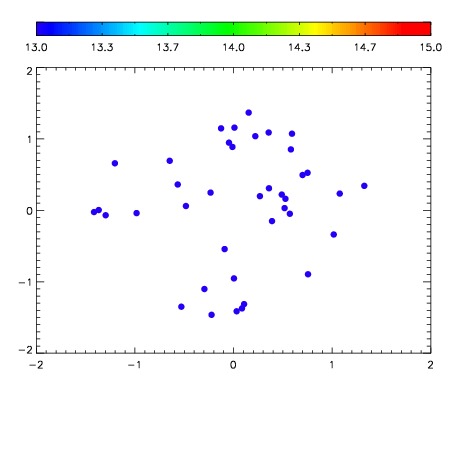

| Frame | Nreads | Zeropoints | Mag plots | Spatial mag deviation | Spatial sky 16325A emission deviations (filled: sky, open: star) | Spatial sky continuum emission | Spatial sky telluric CO2 absorption deviations (filled: H < 10) | |||||||||||||||||||||||
| 0 | 0 |
|
|
|
|
|
|
| IPAIR | NAME | SHIFT | NEWSHIFT | S/N | NAME | SHIFT | NEWSHIFT | S/N |
| 0 | 02880033 | 0.413163 | 0.00000 | 19.0526 | 02880027 | 0.00000 | 0.413163 | 19.0402 |
| 1 | 02880029 | 0.411837 | 0.00132599 | 19.0721 | 02880031 | 9.33609e-06 | 0.413154 | 19.0541 |
| 2 | 02880028 | 0.410792 | 0.00237101 | 19.0716 | 02880034 | 0.00225118 | 0.410912 | 19.0529 |
| 3 | 02880032 | 0.412830 | 0.000333011 | 19.0137 | 02880030 | 0.00114453 | 0.412018 | 18.9291 |