| Red | Green | Blue | |
| z | 17.64 | ||
| znorm | Inf | ||
| sky | -Inf | -NaN | -NaN |
| S/N | 26.8 | 47.2 | 49.1 |
| S/N(c) | 0.0 | 0.0 | 0.0 |
| SN(E/C) |

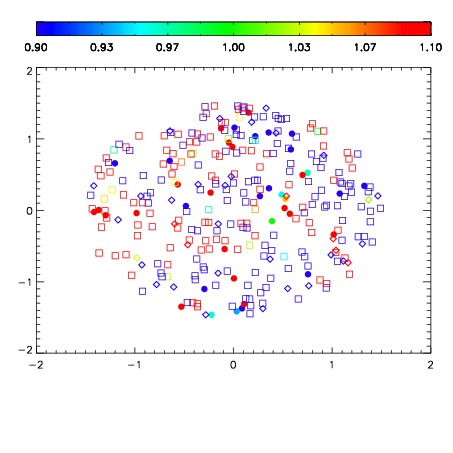


| Frame | Nreads | Zeropoints | Mag plots | Spatial mag deviation | Spatial sky 16325A emission deviations (filled: sky, open: star) | Spatial sky continuum emission | Spatial sky telluric CO2 absorption deviations (filled: H < 10) | |||||||||||||||||||||||
| 0 | 0 |
|
|
|
|
|
|
| IPAIR | NAME | SHIFT | NEWSHIFT | S/N | NAME | SHIFT | NEWSHIFT | S/N |
| 0 | 03060031 | 0.496138 | 0.00000 | 19.0329 | 03060032 | 0.00330957 | 0.492828 | 19.0802 |
| 1 | 03060030 | 0.495887 | 0.000250995 | 18.9784 | 03060029 | -0.00181529 | 0.497953 | 18.8909 |
| 2 | 03060026 | 0.493722 | 0.00241601 | 18.8278 | 03060025 | 0.00000 | 0.496138 | 18.8315 |
| 3 | 03060027 | 0.494785 | 0.00135300 | 18.6856 | 03060028 | -0.00125496 | 0.497393 | 18.8017 |