| Red | Green | Blue | |
| z | 17.64 | ||
| znorm | Inf | ||
| sky | -Inf | -Inf | -Inf |
| S/N | 25.4 | 43.2 | 44.7 |
| S/N(c) | 0.0 | 0.0 | 0.0 |
| SN(E/C) |

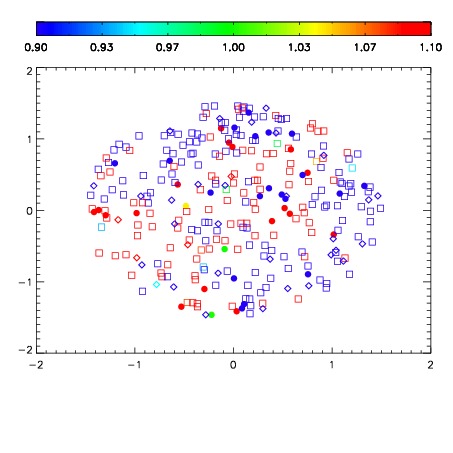


| Frame | Nreads | Zeropoints | Mag plots | Spatial mag deviation | Spatial sky 16325A emission deviations (filled: sky, open: star) | Spatial sky continuum emission | Spatial sky telluric CO2 absorption deviations (filled: H < 10) | |||||||||||||||||||||||
| 0 | 0 |
|
|
|
|
|
|
| IPAIR | NAME | SHIFT | NEWSHIFT | S/N | NAME | SHIFT | NEWSHIFT | S/N |
| 0 | 03140025 | 0.500598 | 0.00000 | 18.9119 | 03140023 | 0.00000 | 0.500598 | 18.9074 |
| 1 | 03140029 | 0.499715 | 0.000883013 | 18.9606 | 03140030 | -0.00116240 | 0.501760 | 19.0188 |
| 2 | 03140024 | 0.499123 | 0.00147501 | 18.7769 | 03140027 | 0.00119337 | 0.499405 | 18.7639 |
| 3 | 03140028 | 0.498368 | 0.00223002 | 18.7375 | 03140026 | 0.00314296 | 0.497455 | 18.6307 |