| Red | Green | Blue | |
| z | 17.64 | ||
| znorm | Inf | ||
| sky | -Inf | -Inf | -Inf |
| S/N | 25.3 | 44.5 | 47.9 |
| S/N(c) | 0.0 | 0.0 | 0.0 |
| SN(E/C) |
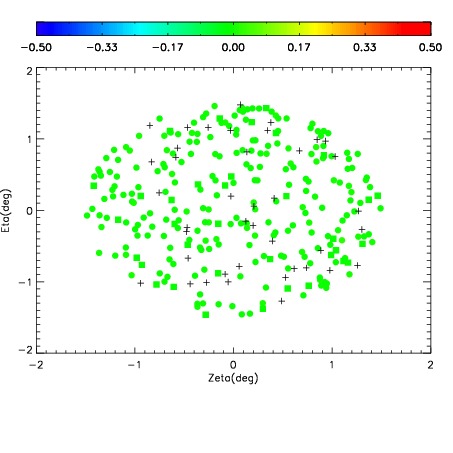
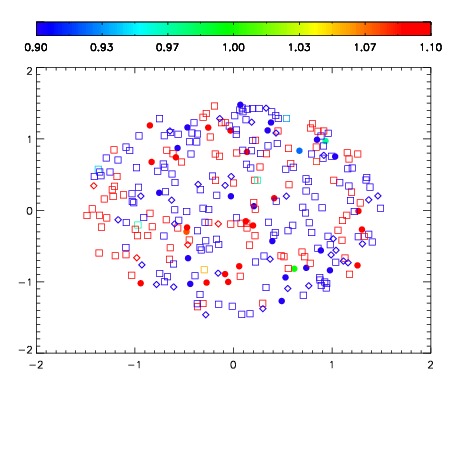


| Frame | Nreads | Zeropoints | Mag plots | Spatial mag deviation | Spatial sky 16325A emission deviations (filled: sky, open: star) | Spatial sky continuum emission | Spatial sky telluric CO2 absorption deviations (filled: H < 10) | |||||||||||||||||||||||
| 0 | 0 |
|
|
|
|
|
|
| IPAIR | NAME | SHIFT | NEWSHIFT | S/N | NAME | SHIFT | NEWSHIFT | S/N |
| 0 | 02870051 | 0.416743 | 0.00000 | 18.9581 | 02870052 | 0.00256581 | 0.414177 | 18.9720 |
| 1 | 02870054 | 0.414393 | 0.00235000 | 19.1600 | 02870056 | 0.00397775 | 0.412765 | 19.1397 |
| 2 | 02870055 | 0.416258 | 0.000485003 | 19.1352 | 02870053 | 0.000846643 | 0.415896 | 19.1150 |
| 3 | 02870050 | 0.415493 | 0.00125000 | 18.9791 | 02870049 | 0.00000 | 0.416743 | 19.0012 |