| Red | Green | Blue | |
| z | 17.64 | ||
| znorm | Inf | ||
| sky | -Inf | -NaN | -Inf |
| S/N | 24.8 | 42.2 | 44.9 |
| S/N(c) | 0.0 | 0.0 | 0.0 |
| SN(E/C) |
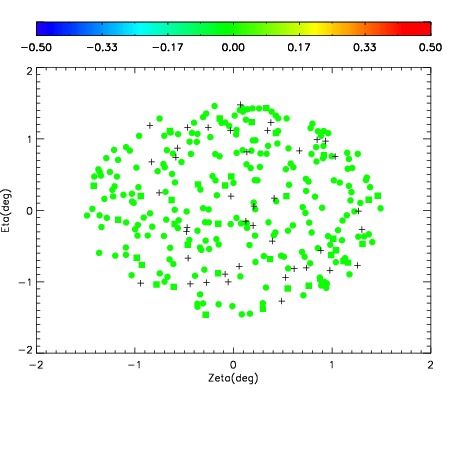
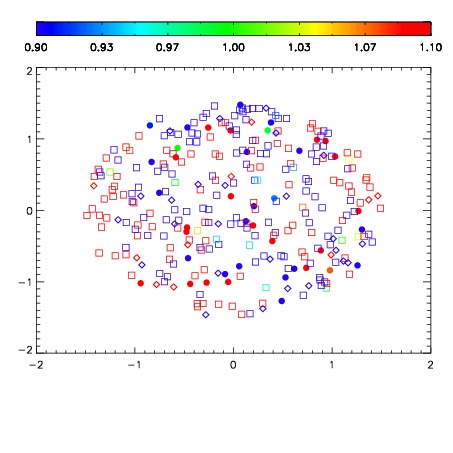
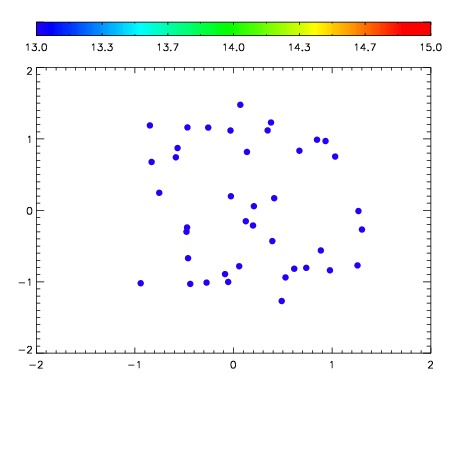

| Frame | Nreads | Zeropoints | Mag plots | Spatial mag deviation | Spatial sky 16325A emission deviations (filled: sky, open: star) | Spatial sky continuum emission | Spatial sky telluric CO2 absorption deviations (filled: H < 10) | |||||||||||||||||||||||
| 0 | 0 |
|
|
|
|
|
|
| IPAIR | NAME | SHIFT | NEWSHIFT | S/N | NAME | SHIFT | NEWSHIFT | S/N |
| 0 | 03190016 | 0.503670 | 0.00000 | 19.0386 | 03190017 | 0.00102377 | 0.502646 | 19.0098 |
| 1 | 03190012 | 0.500963 | 0.00270700 | 19.1497 | 03190014 | -0.00148327 | 0.505153 | 19.1404 |
| 2 | 03190015 | 0.502377 | 0.00129300 | 19.1215 | 03190013 | -0.00221844 | 0.505888 | 19.1397 |
| 3 | 03190011 | 0.496951 | 0.00671896 | 19.1213 | 03190010 | 0.00000 | 0.503670 | 19.0949 |