| Red | Green | Blue | |
| z | 17.64 | ||
| znorm | Inf | ||
| sky | -Inf | -NaN | -Inf |
| S/N | 31.4 | 51.9 | 55.0 |
| S/N(c) | 0.0 | 0.0 | 0.0 |
| SN(E/C) |
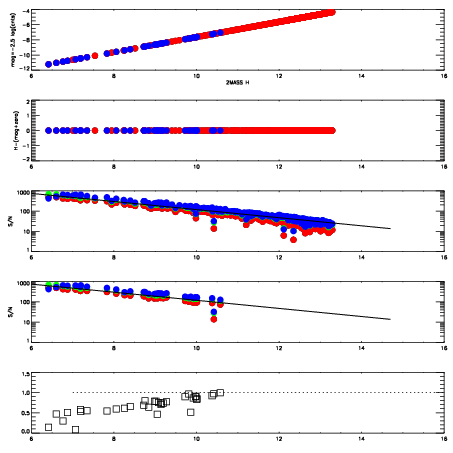

| Frame | Nreads | Zeropoints | Mag plots | Spatial mag deviation | Spatial sky 16325A emission deviations (filled: sky, open: star) | Spatial sky continuum emission | Spatial sky telluric CO2 absorption deviations (filled: H < 10) | |||||||||||||||||||||||
| 0 | 0 |
|
|
|
|
|
|
| IPAIR | NAME | SHIFT | NEWSHIFT | S/N | NAME | SHIFT | NEWSHIFT | S/N |
| 0 | 02860055 | 0.412522 | 0.00000 | 19.1788 | 02860056 | 0.00174368 | 0.410778 | 19.1657 |
| 1 | 02860054 | 0.411278 | 0.00124398 | 19.1934 | 02860053 | 0.00000 | 0.412522 | 19.1807 |
| 2 | 02860058 | 0.411434 | 0.00108799 | 19.1060 | 02860057 | 0.000917772 | 0.411604 | 19.1363 |
| 3 | 02860059 | 0.411671 | 0.000850976 | 19.0883 | 02860060 | 0.00102155 | 0.411500 | 19.0697 |