| Red | Green | Blue | |
| z | 17.64 | ||
| znorm | Inf | ||
| sky | -Inf | -Inf | -Inf |
| S/N | 27.6 | 48.8 | 49.8 |
| S/N(c) | 0.0 | 0.0 | 0.0 |
| SN(E/C) |
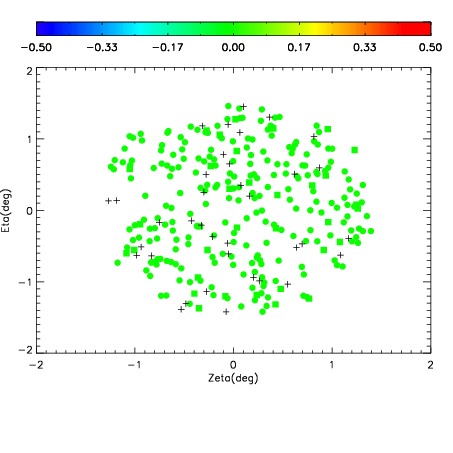
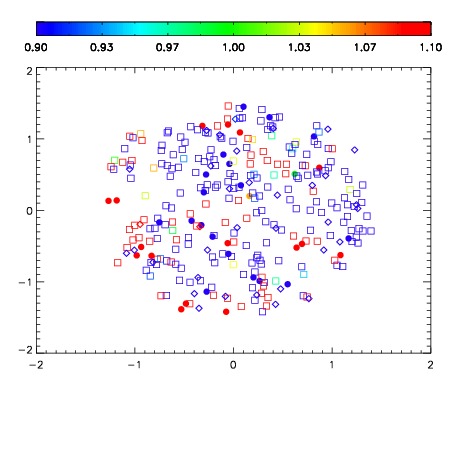
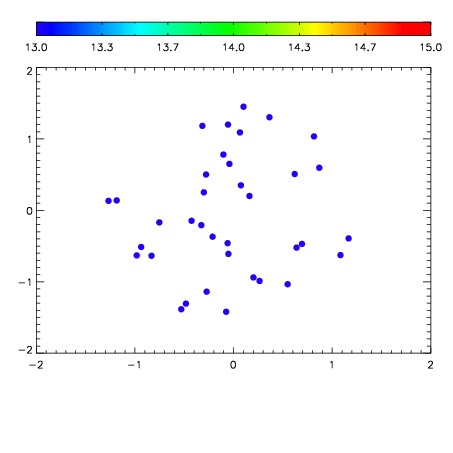

| Frame | Nreads | Zeropoints | Mag plots | Spatial mag deviation | Spatial sky 16325A emission deviations (filled: sky, open: star) | Spatial sky continuum emission | Spatial sky telluric CO2 absorption deviations (filled: H < 10) | |||||||||||||||||||||||
| 0 | 0 |
|
|
|
|
|
|
| IPAIR | NAME | SHIFT | NEWSHIFT | S/N | NAME | SHIFT | NEWSHIFT | S/N |
| 0 | 02830053 | 0.412345 | 0.00000 | 19.0783 | 02830051 | -0.000892798 | 0.413238 | 19.1392 |
| 1 | 02830049 | 0.411854 | 0.000490993 | 19.1412 | 02830054 | 0.00228226 | 0.410063 | 19.1394 |
| 2 | 02830048 | 0.410875 | 0.00147000 | 19.0748 | 02830050 | 0.00214234 | 0.410203 | 19.1210 |
| 3 | 02830052 | 0.409957 | 0.00238800 | 19.0670 | 02830047 | 0.00000 | 0.412345 | 19.1177 |