| Red | Green | Blue | |
| z | 17.64 | ||
| znorm | Inf | ||
| sky | -Inf | -NaN | -Inf |
| S/N | 25.3 | 44.2 | 45.5 |
| S/N(c) | 0.0 | 0.0 | 0.0 |
| SN(E/C) |

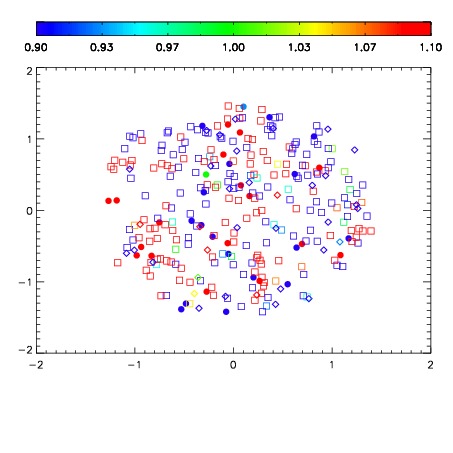
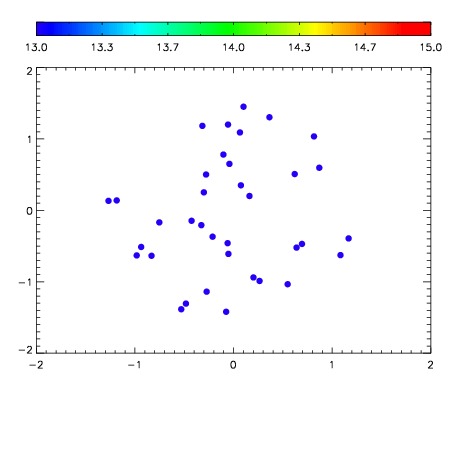

| Frame | Nreads | Zeropoints | Mag plots | Spatial mag deviation | Spatial sky 16325A emission deviations (filled: sky, open: star) | Spatial sky continuum emission | Spatial sky telluric CO2 absorption deviations (filled: H < 10) | |||||||||||||||||||||||
| 0 | 0 |
|
|
|
|
|
|
| IPAIR | NAME | SHIFT | NEWSHIFT | S/N | NAME | SHIFT | NEWSHIFT | S/N |
| 0 | 02870044 | 0.414432 | 0.00000 | 19.0579 | 02870045 | 0.00173123 | 0.412701 | 19.0570 |
| 1 | 02870039 | 0.407513 | 0.00691900 | 18.9881 | 02870041 | 0.00213346 | 0.412299 | 18.9810 |
| 2 | 02870040 | 0.410724 | 0.00370798 | 18.9860 | 02870042 | 0.00110862 | 0.413323 | 18.9749 |
| 3 | 02870043 | 0.413224 | 0.00120798 | 18.9189 | 02870038 | 0.00000 | 0.414432 | 18.9603 |