| Red | Green | Blue | |
| z | 17.64 | ||
| znorm | Inf | ||
| sky | -Inf | -Inf | -Inf |
| S/N | 15.7 | 27.3 | 28.9 |
| S/N(c) | 0.0 | 0.0 | 0.0 |
| SN(E/C) |
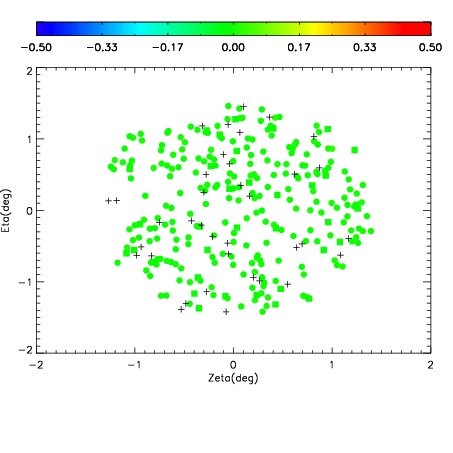
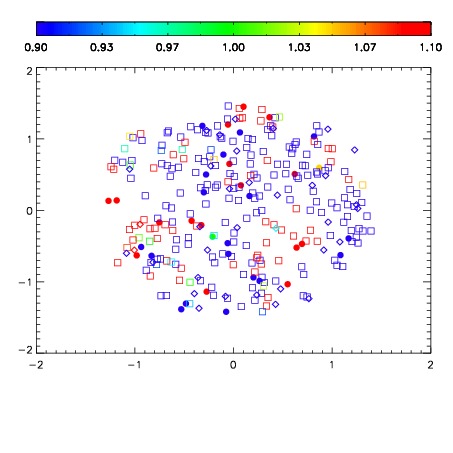
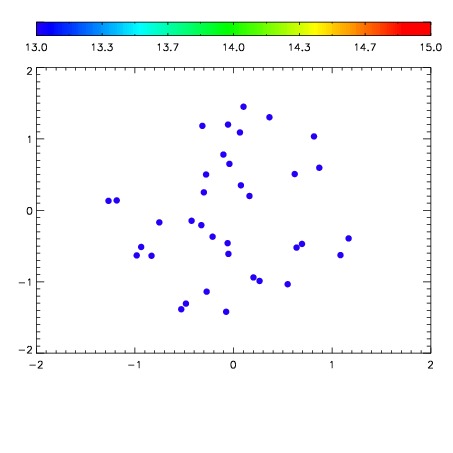

| Frame | Nreads | Zeropoints | Mag plots | Spatial mag deviation | Spatial sky 16325A emission deviations (filled: sky, open: star) | Spatial sky continuum emission | Spatial sky telluric CO2 absorption deviations (filled: H < 10) | |||||||||||||||||||||||
| 0 | 0 |
|
|
|
|
|
|
| IPAIR | NAME | SHIFT | NEWSHIFT | S/N | NAME | SHIFT | NEWSHIFT | S/N |
| 0 | 03100049 | 0.503818 | 0.00000 | 14.4314 | 03100050 | 0.0110308 | 0.492787 | 14.7837 |
| 1 | 03100044 | 0.500653 | 0.00316495 | 18.9112 | 03100043 | 0.00000 | 0.503818 | 18.8792 |
| 2 | 03100045 | 0.500653 | 0.00316495 | 18.8136 | 03100046 | 0.00257778 | 0.501240 | 18.6432 |
| 3 | 03100048 | 0.503637 | 0.000180960 | 15.8318 | 03100047 | -0.000254090 | 0.504072 | 16.5601 |