| Red | Green | Blue | |
| z | 17.64 | ||
| znorm | Inf | ||
| sky | -NaN | -NaN | -Inf |
| S/N | 28.0 | 49.6 | 53.8 |
| S/N(c) | 0.0 | 0.0 | 0.0 |
| SN(E/C) |
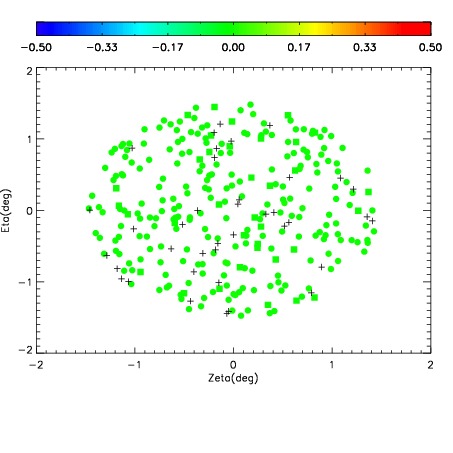


| Frame | Nreads | Zeropoints | Mag plots | Spatial mag deviation | Spatial sky 16325A emission deviations (filled: sky, open: star) | Spatial sky continuum emission | Spatial sky telluric CO2 absorption deviations (filled: H < 10) | |||||||||||||||||||||||
| 0 | 0 |
|
|
|
|
|
|
| IPAIR | NAME | SHIFT | NEWSHIFT | S/N | NAME | SHIFT | NEWSHIFT | S/N |
| 0 | 06060049 | 0.491375 | 0.00000 | 19.0485 | 06060050 | 0.00321456 | 0.488160 | 19.1201 |
| 1 | 06060053 | 0.488794 | 0.00258100 | 19.1711 | 06060054 | 0.00344641 | 0.487929 | 19.1655 |
| 2 | 06060052 | 0.489014 | 0.00236100 | 19.1029 | 06060051 | 0.00177455 | 0.489600 | 19.1216 |
| 3 | 06060048 | 0.490546 | 0.000829011 | 18.9696 | 06060047 | 0.00000 | 0.491375 | 18.9069 |