| Red | Green | Blue | |
| z | 17.64 | ||
| znorm | Inf | ||
| sky | -Inf | -Inf | -Inf |
| S/N | 15.5 | 27.8 | 30.0 |
| S/N(c) | 0.0 | 0.0 | 0.0 |
| SN(E/C) |
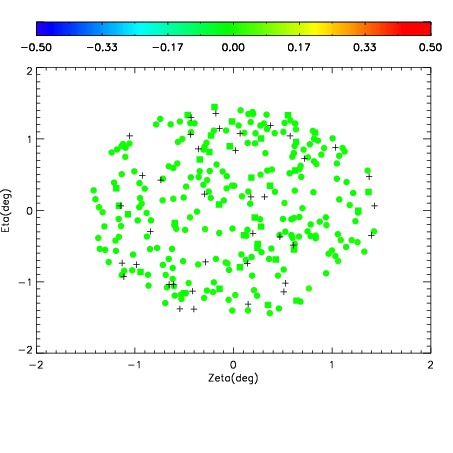
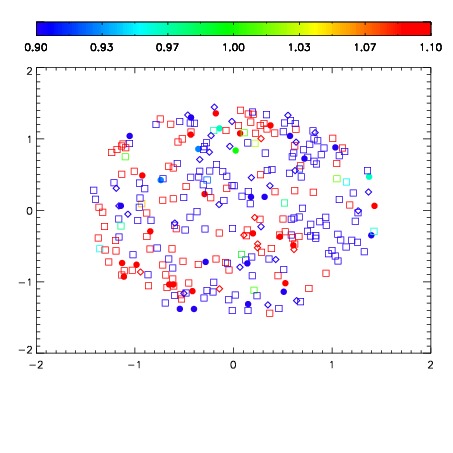
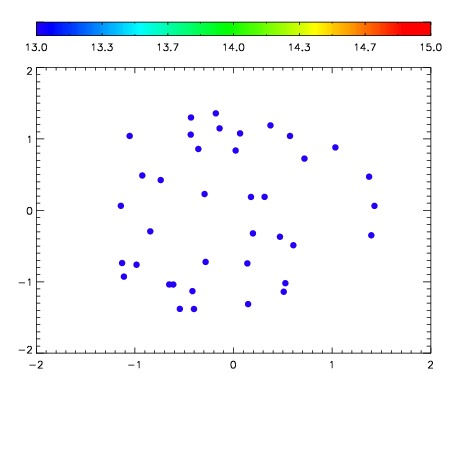

| Frame | Nreads | Zeropoints | Mag plots | Spatial mag deviation | Spatial sky 16325A emission deviations (filled: sky, open: star) | Spatial sky continuum emission | Spatial sky telluric CO2 absorption deviations (filled: H < 10) | |||||||||||||||||||||||
| 0 | 0 |
|
|
|
|
|
|
| IPAIR | NAME | SHIFT | NEWSHIFT | S/N | NAME | SHIFT | NEWSHIFT | S/N |
| 0 | 03440021 | 0.499421 | 0.00000 | 17.8322 | 03440022 | 0.00100806 | 0.498413 | 17.6922 |
| 1 | 03440025 | 0.499041 | 0.000380009 | 18.5421 | 03440019 | 0.00000 | 0.499421 | 19.0238 |
| 2 | 03440020 | 0.498636 | 0.000784993 | 18.3475 | 03440026 | -0.00250137 | 0.501922 | 18.2142 |
| 3 | 03440024 | 0.497499 | 0.00192201 | 18.1616 | 03440023 | -0.00314622 | 0.502567 | 17.7268 |