| Red | Green | Blue | |
| z | 17.64 | ||
| znorm | Inf | ||
| sky | -NaN | -NaN | -NaN |
| S/N | 29.7 | 50.7 | 53.5 |
| S/N(c) | 0.0 | 0.0 | 0.0 |
| SN(E/C) |
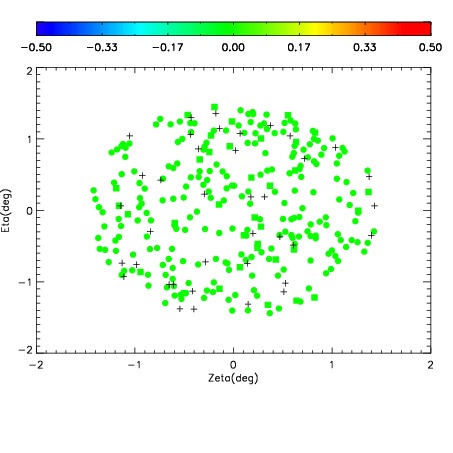

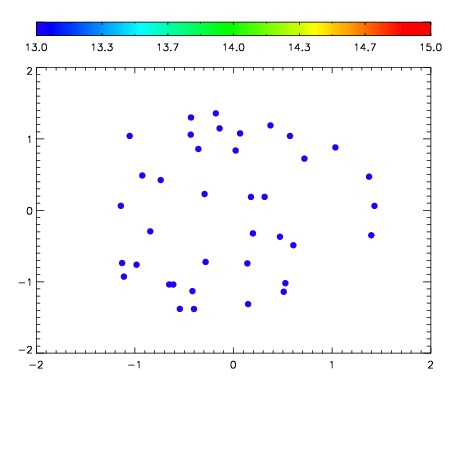

| Frame | Nreads | Zeropoints | Mag plots | Spatial mag deviation | Spatial sky 16325A emission deviations (filled: sky, open: star) | Spatial sky continuum emission | Spatial sky telluric CO2 absorption deviations (filled: H < 10) | |||||||||||||||||||||||
| 0 | 0 |
|
|
|
|
|
|
| IPAIR | NAME | SHIFT | NEWSHIFT | S/N | NAME | SHIFT | NEWSHIFT | S/N |
| 0 | 06430041 | 0.482850 | 0.00000 | 19.1666 | 06430036 | 0.00000 | 0.482850 | 19.1881 |
| 1 | 06430037 | 0.481188 | 0.00166199 | 19.1660 | 06430040 | -0.00148858 | 0.484339 | 19.1695 |
| 2 | 06430038 | 0.481094 | 0.00175598 | 19.1602 | 06430039 | -7.47858e-05 | 0.482925 | 19.1606 |
| 3 | 06430042 | 0.482777 | 7.29859e-05 | 19.1431 | 06430043 | -0.000623642 | 0.483474 | 19.1125 |