| Red | Green | Blue | |
| z | 17.64 | ||
| znorm | Inf | ||
| sky | -Inf | -Inf | -Inf |
| S/N | 19.4 | 35.3 | 37.2 |
| S/N(c) | 0.0 | 0.0 | 0.0 |
| SN(E/C) |
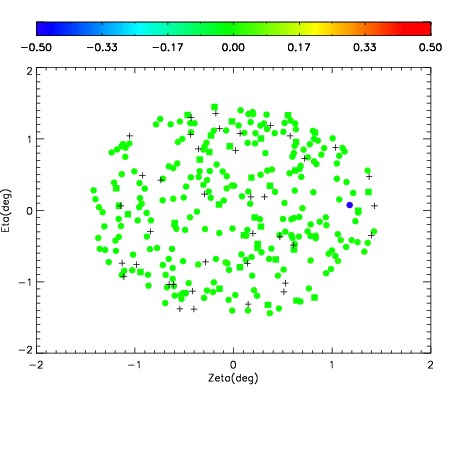
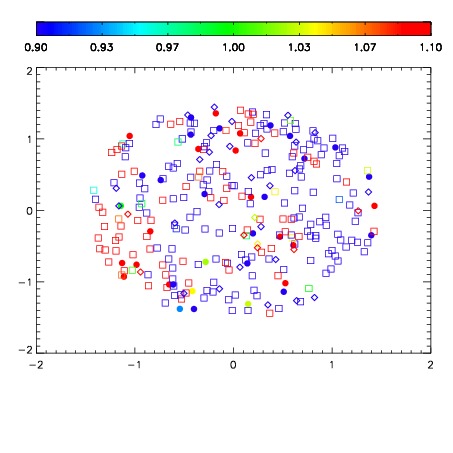
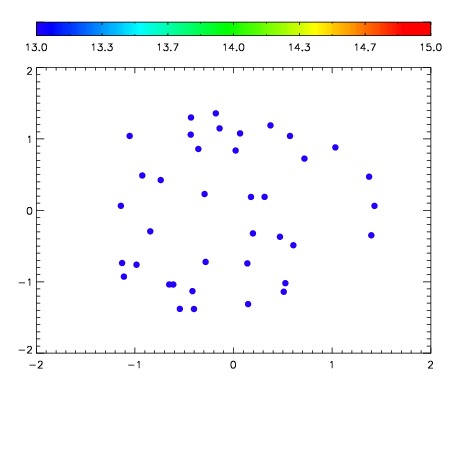

| Frame | Nreads | Zeropoints | Mag plots | Spatial mag deviation | Spatial sky 16325A emission deviations (filled: sky, open: star) | Spatial sky continuum emission | Spatial sky telluric CO2 absorption deviations (filled: H < 10) | |||||||||||||||||||||||
| 0 | 0 |
|
|
|
|
|
|
| IPAIR | NAME | SHIFT | NEWSHIFT | S/N | NAME | SHIFT | NEWSHIFT | S/N |
| 0 | 06620045 | 0.483943 | 0.00000 | 18.9028 | 06620047 | 0.00176778 | 0.482175 | 18.9450 |
| 1 | 06620044 | 0.483887 | 5.59986e-05 | 18.9190 | 06620046 | 0.00207868 | 0.481864 | 18.9848 |
| 2 | 06620048 | 0.481716 | 0.00222698 | 18.4830 | 06620043 | 0.00000 | 0.483943 | 18.6402 |