| Red | Green | Blue | |
| z | 17.64 | ||
| znorm | Inf | ||
| sky | -Inf | -Inf | -Inf |
| S/N | 28.0 | 47.1 | 49.8 |
| S/N(c) | 0.0 | 0.0 | 0.0 |
| SN(E/C) |
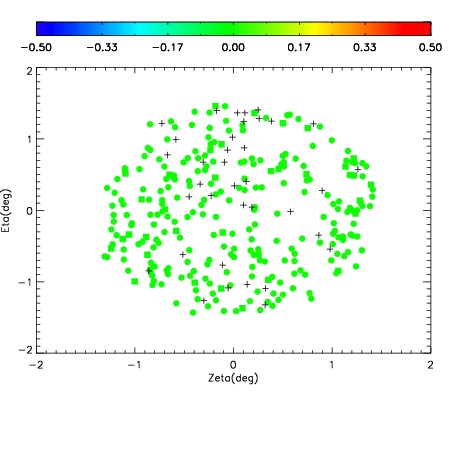
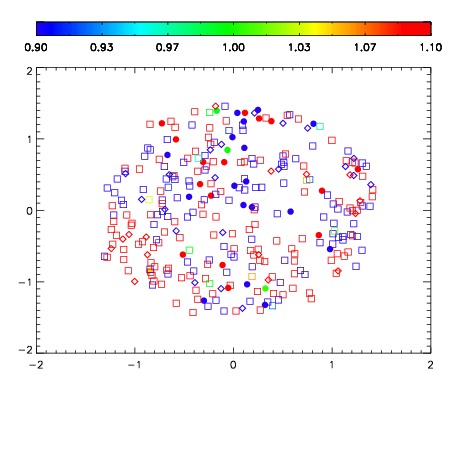


| Frame | Nreads | Zeropoints | Mag plots | Spatial mag deviation | Spatial sky 16325A emission deviations (filled: sky, open: star) | Spatial sky continuum emission | Spatial sky telluric CO2 absorption deviations (filled: H < 10) | |||||||||||||||||||||||
| 0 | 0 |
|
|
|
|
|
|
| IPAIR | NAME | SHIFT | NEWSHIFT | S/N | NAME | SHIFT | NEWSHIFT | S/N |
| 0 | 02890051 | 0.403410 | 0.00000 | 19.0121 | 02890056 | -0.000129415 | 0.403539 | 18.9601 |
| 1 | 02890055 | 0.399304 | 0.00410599 | 19.0348 | 02890052 | -0.00213695 | 0.405547 | 18.9862 |
| 2 | 02890054 | 0.397241 | 0.00616899 | 19.0217 | 02890049 | 0.00000 | 0.403410 | 18.9667 |
| 3 | 02890050 | 0.401567 | 0.00184298 | 18.9891 | 02890053 | -0.00224688 | 0.405657 | 18.8877 |