| Red | Green | Blue | |
| z | 17.64 | ||
| znorm | Inf | ||
| sky | -Inf | -NaN | -Inf |
| S/N | 21.9 | 38.3 | 41.6 |
| S/N(c) | 0.0 | 0.0 | 0.0 |
| SN(E/C) |
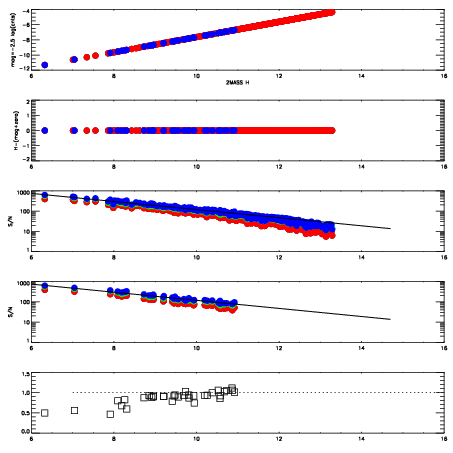
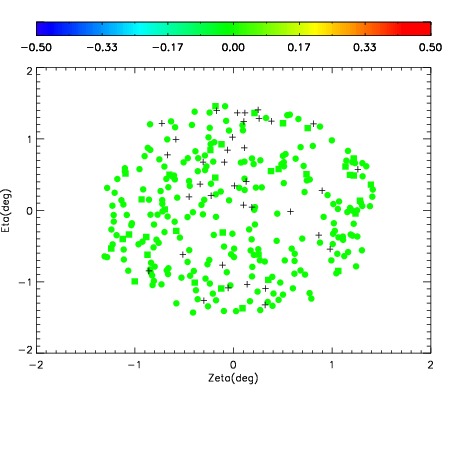
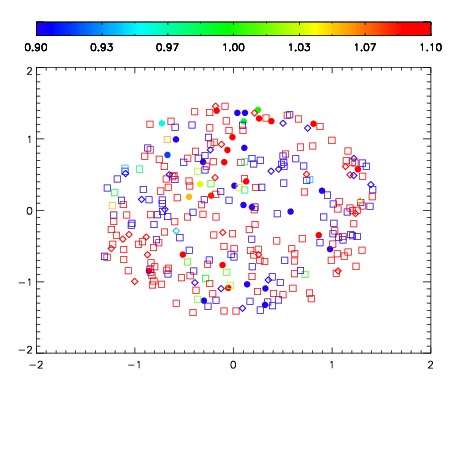


| Frame | Nreads | Zeropoints | Mag plots | Spatial mag deviation | Spatial sky 16325A emission deviations (filled: sky, open: star) | Spatial sky continuum emission | Spatial sky telluric CO2 absorption deviations (filled: H < 10) | |||||||||||||||||||||||
| 0 | 0 |
|
|
|
|
|
|
| IPAIR | NAME | SHIFT | NEWSHIFT | S/N | NAME | SHIFT | NEWSHIFT | S/N |
| 0 | 03070036 | 0.500020 | 0.00000 | 18.8668 | 03070037 | -0.00132009 | 0.501340 | 18.5864 |
| 1 | 03070035 | 0.499296 | 0.000724018 | 18.9870 | 03070034 | 0.00000 | 0.500020 | 18.9389 |
| 2 | 03070039 | 0.498750 | 0.00127003 | 18.6057 | 03070038 | -0.00317010 | 0.503190 | 18.4861 |
| 3 | 03070040 | 0.498649 | 0.00137103 | 18.4711 | 03070041 | 0.00108518 | 0.498935 | 17.5137 |