| Red | Green | Blue | |
| z | 17.64 | ||
| znorm | Inf | ||
| sky | -Inf | -Inf | -Inf |
| S/N | 26.5 | 44.1 | 47.1 |
| S/N(c) | 0.0 | 0.0 | 0.0 |
| SN(E/C) |
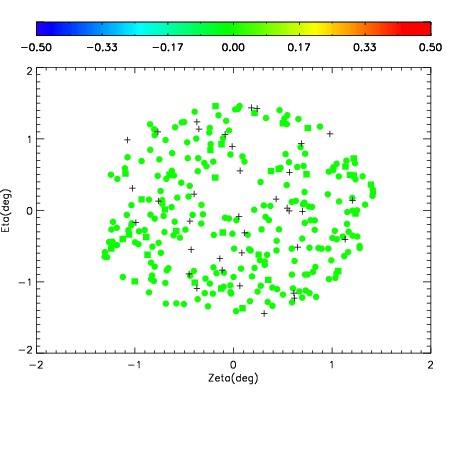
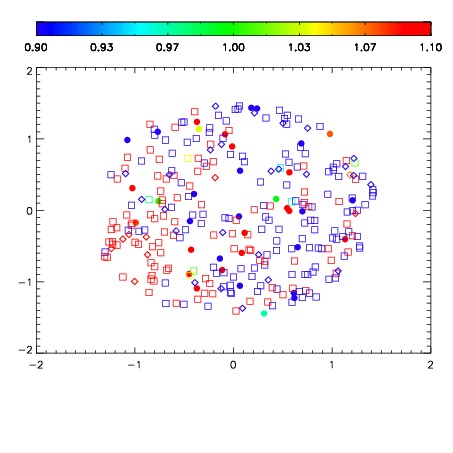
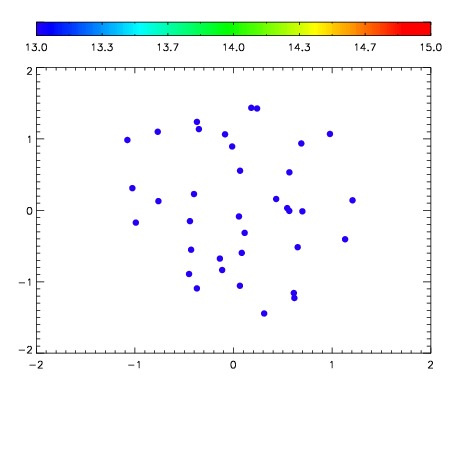

| Frame | Nreads | Zeropoints | Mag plots | Spatial mag deviation | Spatial sky 16325A emission deviations (filled: sky, open: star) | Spatial sky continuum emission | Spatial sky telluric CO2 absorption deviations (filled: H < 10) | |||||||||||||||||||||||
| 0 | 0 |
|
|
|
|
|
|
| IPAIR | NAME | SHIFT | NEWSHIFT | S/N | NAME | SHIFT | NEWSHIFT | S/N |
| 0 | 02880044 | 0.407582 | 0.00000 | 18.9449 | 02880038 | 0.00000 | 0.407582 | 18.8541 |
| 1 | 02880040 | 0.407345 | 0.000237018 | 19.0613 | 02880041 | 0.00162774 | 0.405954 | 19.0884 |
| 2 | 02880039 | 0.406386 | 0.00119603 | 19.0127 | 02880045 | 0.000774971 | 0.406807 | 18.9844 |
| 3 | 02880043 | 0.405997 | 0.00158501 | 18.9521 | 02880042 | -0.00177107 | 0.409353 | 18.9682 |