| Red | Green | Blue | |
| z | 17.64 | ||
| znorm | Inf | ||
| sky | -Inf | -Inf | -Inf |
| S/N | 23.4 | 41.7 | 44.0 |
| S/N(c) | 0.0 | 0.0 | 0.0 |
| SN(E/C) |
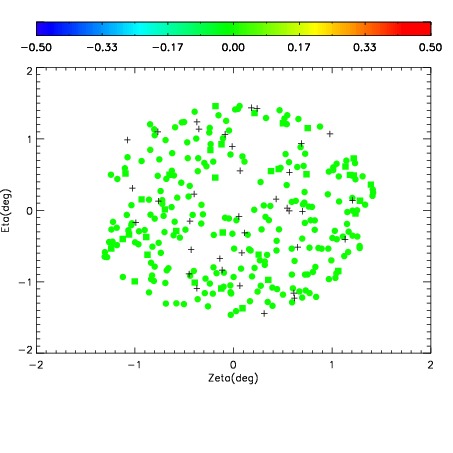
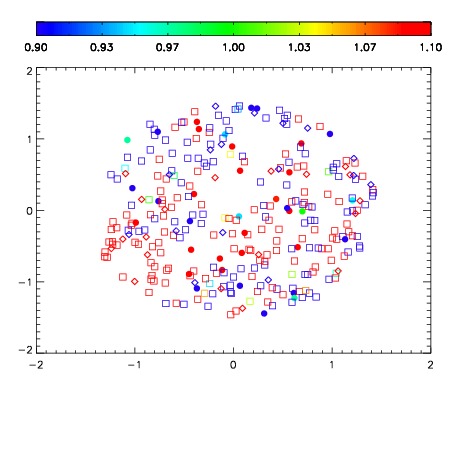
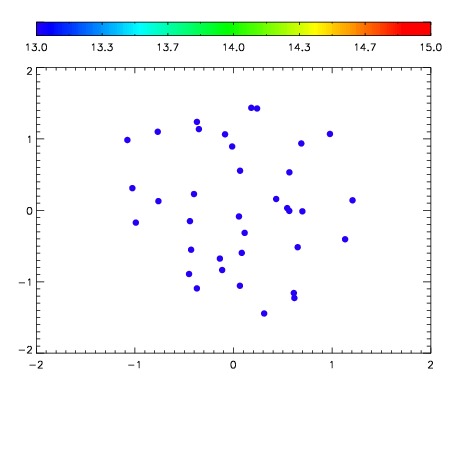

| Frame | Nreads | Zeropoints | Mag plots | Spatial mag deviation | Spatial sky 16325A emission deviations (filled: sky, open: star) | Spatial sky continuum emission | Spatial sky telluric CO2 absorption deviations (filled: H < 10) | |||||||||||||||||||||||
| 0 | 0 |
|
|
|
|
|
|
| IPAIR | NAME | SHIFT | NEWSHIFT | S/N | NAME | SHIFT | NEWSHIFT | S/N |
| 0 | 03090036 | 0.494876 | 0.00000 | 18.8346 | 03090037 | 0.00775983 | 0.487116 | 18.8165 |
| 1 | 03090035 | 0.494725 | 0.000151008 | 18.8524 | 03090041 | 0.00648650 | 0.488389 | 18.8173 |
| 2 | 03090040 | 0.492216 | 0.00266001 | 18.7932 | 03090038 | 0.00463554 | 0.490240 | 18.7663 |
| 3 | 03090039 | 0.492149 | 0.00272700 | 18.7487 | 03090034 | 0.00000 | 0.494876 | 18.7275 |