| Red | Green | Blue | |
| z | 17.64 | ||
| znorm | Inf | ||
| sky | -Inf | -Inf | -Inf |
| S/N | 22.0 | 39.8 | 42.2 |
| S/N(c) | 0.0 | 0.0 | 0.0 |
| SN(E/C) |
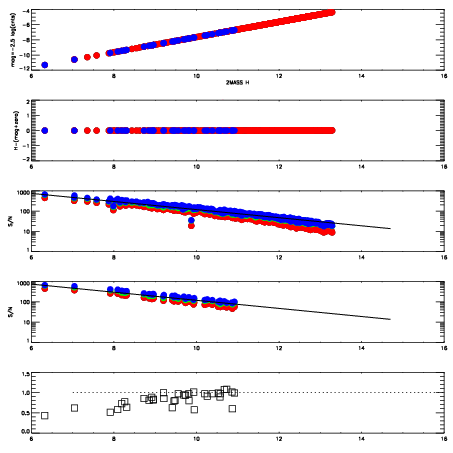
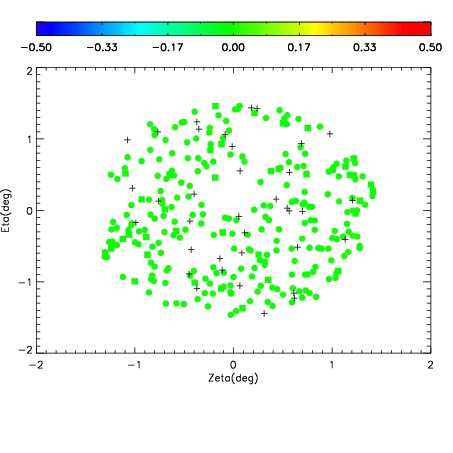
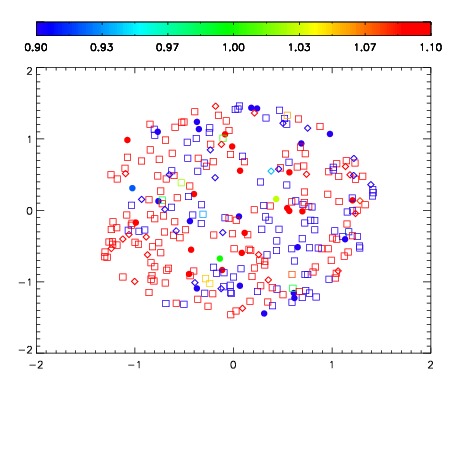
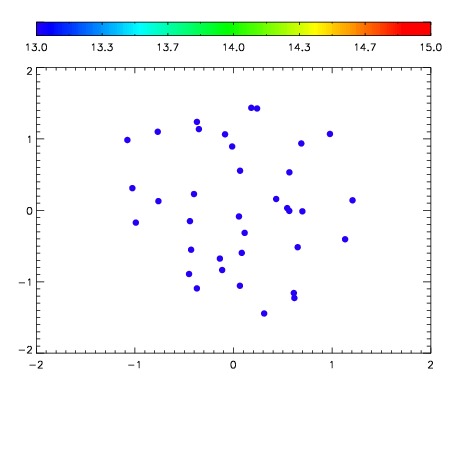

| Frame | Nreads | Zeropoints | Mag plots | Spatial mag deviation | Spatial sky 16325A emission deviations (filled: sky, open: star) | Spatial sky continuum emission | Spatial sky telluric CO2 absorption deviations (filled: H < 10) | |||||||||||||||||||||||
| 0 | 0 |
|
|
|
|
|
|
| IPAIR | NAME | SHIFT | NEWSHIFT | S/N | NAME | SHIFT | NEWSHIFT | S/N |
| 0 | 06420046 | 0.483085 | 0.00000 | 19.0545 | 06420051 | 0.00283406 | 0.480251 | 19.0087 |
| 1 | 06420049 | 0.482205 | 0.000880003 | 18.8331 | 06420048 | -0.000358448 | 0.483443 | 19.0018 |
| 2 | 06420050 | 0.482587 | 0.000497997 | 18.8193 | 06420047 | 0.000512891 | 0.482572 | 18.9828 |
| 3 | 06420045 | 0.482771 | 0.000313997 | 18.7915 | 06420044 | 0.00000 | 0.483085 | 18.5064 |