| Red | Green | Blue | |
| z | 17.64 | ||
| znorm | Inf | ||
| sky | -Inf | -Inf | -Inf |
| S/N | 20.3 | 35.9 | 37.8 |
| S/N(c) | 0.0 | 0.0 | 0.0 |
| SN(E/C) |
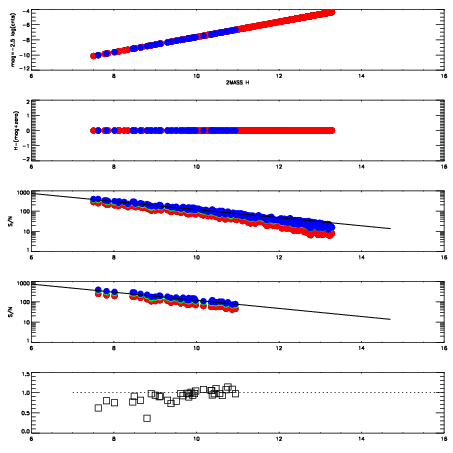
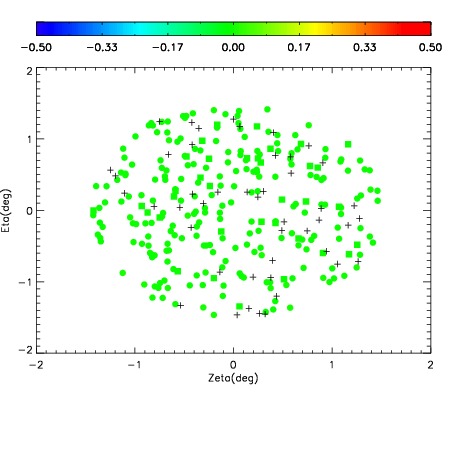
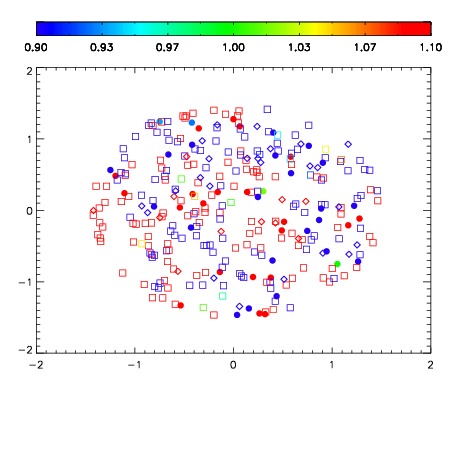
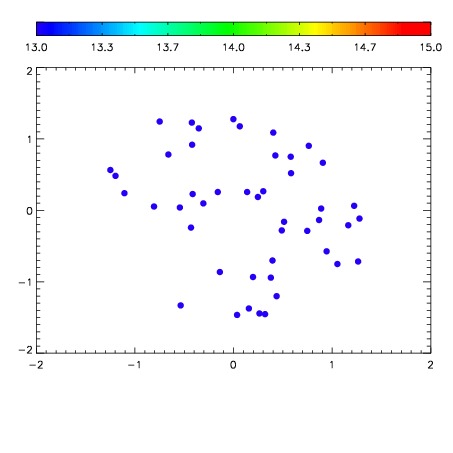

| Frame | Nreads | Zeropoints | Mag plots | Spatial mag deviation | Spatial sky 16325A emission deviations (filled: sky, open: star) | Spatial sky continuum emission | Spatial sky telluric CO2 absorption deviations (filled: H < 10) | |||||||||||||||||||||||
| 0 | 0 |
|
|
|
|
|
|
| IPAIR | NAME | SHIFT | NEWSHIFT | S/N | NAME | SHIFT | NEWSHIFT | S/N |
| 0 | 02620053 | 0.423944 | 0.00000 | 18.0661 | 02620055 | -0.00147676 | 0.425421 | 18.9065 |
| 1 | 02620057 | 0.423437 | 0.000506997 | 19.0294 | 02620054 | -0.000790036 | 0.424734 | 18.9977 |
| 2 | 02620056 | 0.422410 | 0.00153399 | 18.8551 | 02620058 | -0.000215602 | 0.424160 | 18.9776 |
| 3 | 02620052 | 0.422400 | 0.00154400 | 16.0463 | 02620051 | 0.00000 | 0.423944 | 18.3999 |