| Red | Green | Blue | |
| z | 17.64 | ||
| znorm | Inf | ||
| sky | -Inf | -NaN | -NaN |
| S/N | 29.4 | 50.0 | 52.8 |
| S/N(c) | 0.0 | 0.0 | 0.0 |
| SN(E/C) |
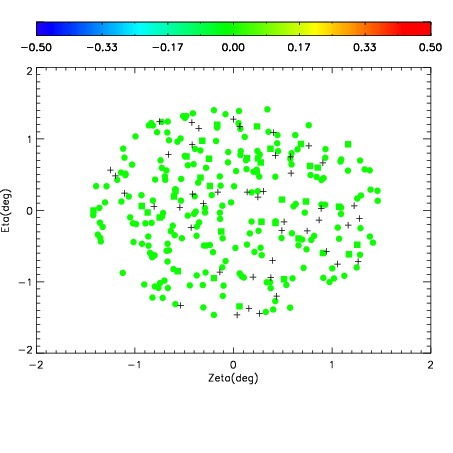
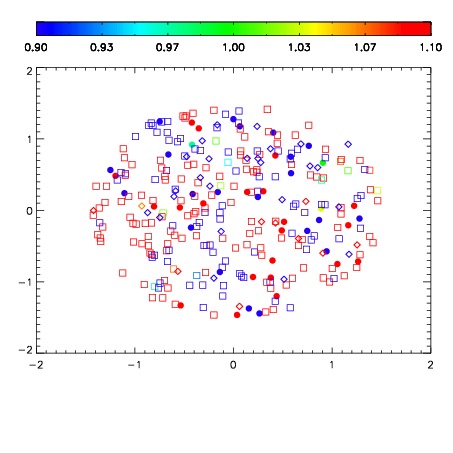
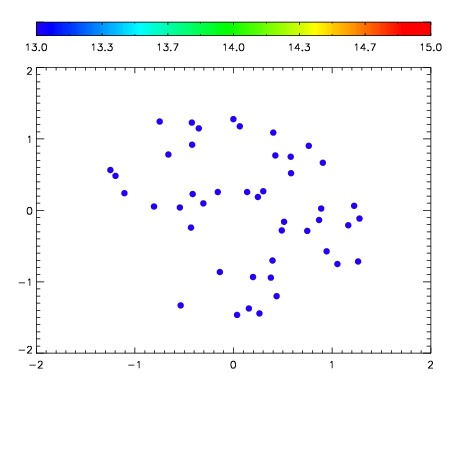

| Frame | Nreads | Zeropoints | Mag plots | Spatial mag deviation | Spatial sky 16325A emission deviations (filled: sky, open: star) | Spatial sky continuum emission | Spatial sky telluric CO2 absorption deviations (filled: H < 10) | |||||||||||||||||||||||
| 0 | 0 |
|
|
|
|
|
|
| IPAIR | NAME | SHIFT | NEWSHIFT | S/N | NAME | SHIFT | NEWSHIFT | S/N |
| 0 | 03190040 | 0.506975 | 0.00000 | 19.0408 | 03190041 | 0.00244661 | 0.504528 | 19.0691 |
| 1 | 03190035 | 0.501836 | 0.00513899 | 19.1667 | 03190037 | 0.00219552 | 0.504779 | 19.1871 |
| 2 | 03190036 | 0.503943 | 0.00303197 | 19.1384 | 03190034 | 0.00000 | 0.506975 | 19.1805 |
| 3 | 03190039 | 0.498393 | 0.00858200 | 19.0878 | 03190038 | 0.00399426 | 0.502981 | 19.1458 |