| Red | Green | Blue | |
| z | 17.64 | ||
| znorm | Inf | ||
| sky | -NaN | -NaN | -NaN |
| S/N | 35.2 | 60.8 | 64.5 |
| S/N(c) | 0.0 | 0.0 | 0.0 |
| SN(E/C) |
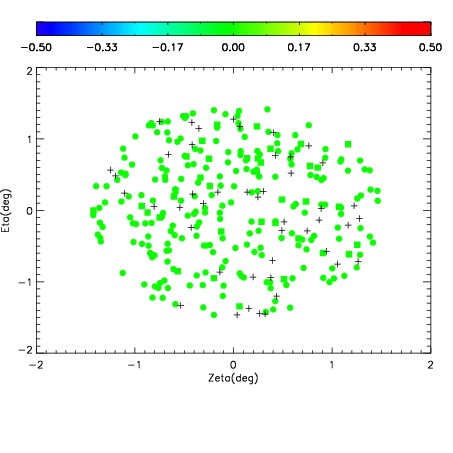
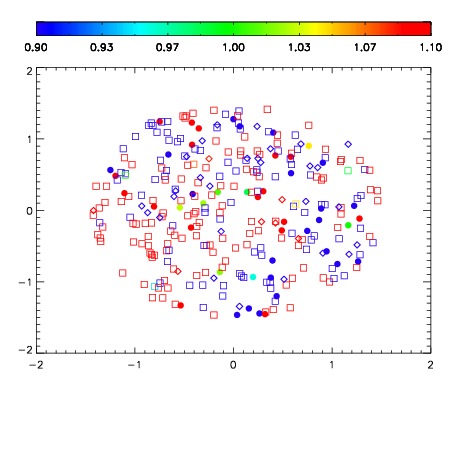
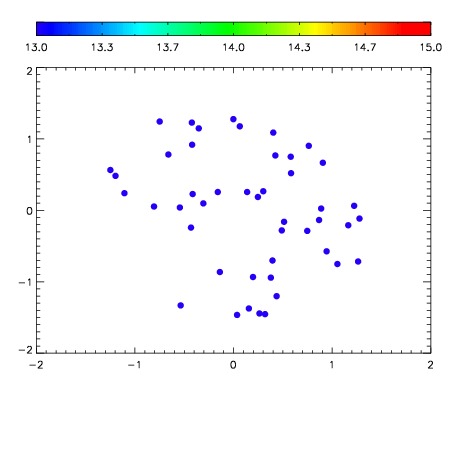

| Frame | Nreads | Zeropoints | Mag plots | Spatial mag deviation | Spatial sky 16325A emission deviations (filled: sky, open: star) | Spatial sky continuum emission | Spatial sky telluric CO2 absorption deviations (filled: H < 10) | |||||||||||||||||||||||
| 0 | 0 |
|
|
|
|
|
|
| IPAIR | NAME | SHIFT | NEWSHIFT | S/N | NAME | SHIFT | NEWSHIFT | S/N |
| 0 | 03640031 | 0.508753 | 0.00000 | 19.0780 | 03640036 | -0.00380888 | 0.512562 | 19.0680 |
| 1 | 03640039 | 0.499840 | 0.00891301 | 19.1833 | 03640040 | -0.00266167 | 0.511415 | 19.1536 |
| 2 | 03640035 | 0.499379 | 0.00937399 | 19.1287 | 03640032 | 0.000207472 | 0.508546 | 19.1334 |
| 3 | 03640030 | 0.506959 | 0.00179398 | 19.1046 | 03640037 | -0.00540614 | 0.514159 | 19.1167 |
| 4 | 03640034 | 0.498956 | 0.00979701 | 19.0937 | 03640033 | -0.00514155 | 0.513895 | 19.1105 |
| 5 | 03640038 | 0.501083 | 0.00766999 | 19.0828 | 03640029 | 0.00000 | 0.508753 | 19.1042 |