| Red | Green | Blue | |
| z | 17.64 | ||
| znorm | Inf | ||
| sky | -NaN | -NaN | -NaN |
| S/N | 35.6 | 58.9 | 62.2 |
| S/N(c) | 0.0 | 0.0 | 0.0 |
| SN(E/C) |

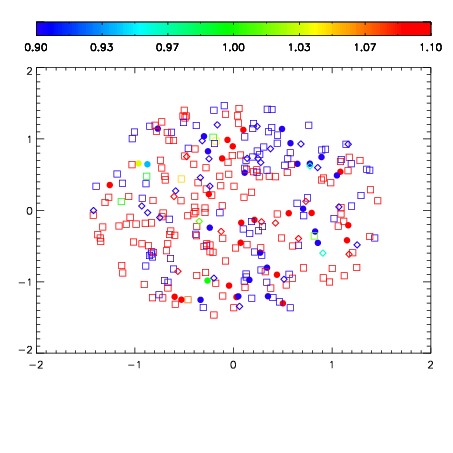
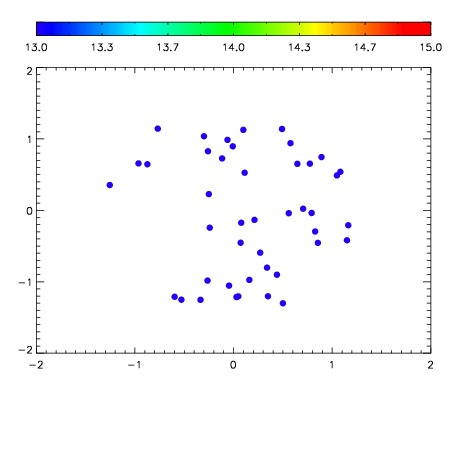

| Frame | Nreads | Zeropoints | Mag plots | Spatial mag deviation | Spatial sky 16325A emission deviations (filled: sky, open: star) | Spatial sky continuum emission | Spatial sky telluric CO2 absorption deviations (filled: H < 10) | |||||||||||||||||||||||
| 0 | 0 |
|
|
|
|
|
|
| IPAIR | NAME | SHIFT | NEWSHIFT | S/N | NAME | SHIFT | NEWSHIFT | S/N |
| 0 | 03650034 | 0.511002 | 0.00000 | 19.0463 | 03650039 | 0.00244608 | 0.508556 | 19.0963 |
| 1 | 03650037 | 0.507916 | 0.00308603 | 19.0694 | 03650036 | -0.00152454 | 0.512527 | 19.1086 |
| 2 | 03650038 | 0.509944 | 0.00105798 | 19.0067 | 03650035 | 0.00322003 | 0.507782 | 19.0888 |
| 3 | 03650041 | 0.508225 | 0.00277698 | 18.9796 | 03650040 | -0.00108328 | 0.512085 | 19.0694 |
| 4 | 03650033 | 0.506745 | 0.00425702 | 18.9411 | 03650032 | 0.00000 | 0.511002 | 19.0378 |
| 5 | 03650042 | 0.508945 | 0.00205702 | 18.8711 | 03650043 | -0.000937564 | 0.511940 | 18.9694 |