| Red | Green | Blue | |
| z | 17.64 | ||
| znorm | Inf | ||
| sky | -Inf | -Inf | -Inf |
| S/N | 27.4 | 47.1 | 49.9 |
| S/N(c) | 0.0 | 0.0 | 0.0 |
| SN(E/C) |
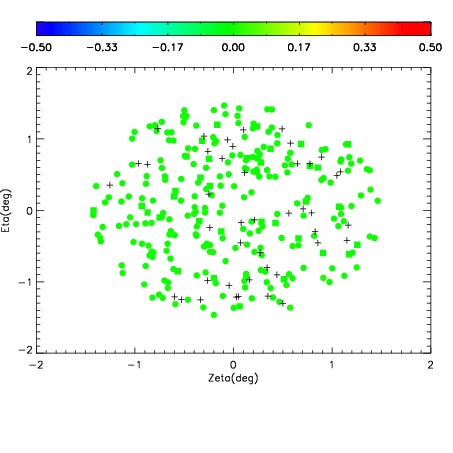
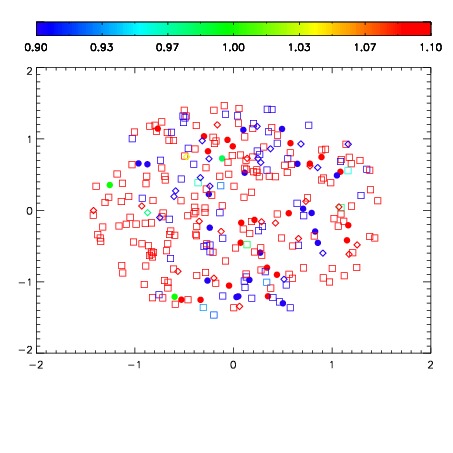
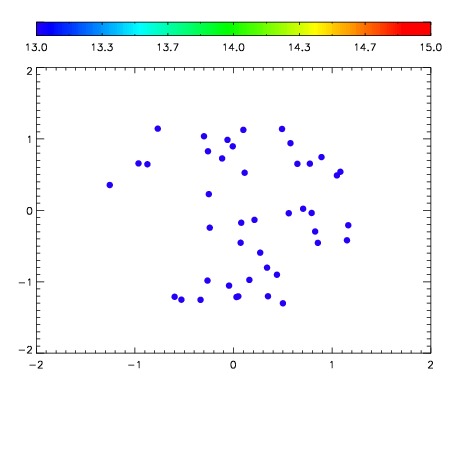

| Frame | Nreads | Zeropoints | Mag plots | Spatial mag deviation | Spatial sky 16325A emission deviations (filled: sky, open: star) | Spatial sky continuum emission | Spatial sky telluric CO2 absorption deviations (filled: H < 10) | |||||||||||||||||||||||
| 0 | 0 |
|
|
|
|
|
|
| IPAIR | NAME | SHIFT | NEWSHIFT | S/N | NAME | SHIFT | NEWSHIFT | S/N |
| 0 | 03690029 | 0.497768 | 0.00000 | 18.8906 | 03690026 | 0.00172045 | 0.496048 | 18.9661 |
| 1 | 03690024 | 0.495470 | 0.00229803 | 19.0547 | 03690023 | 0.00000 | 0.497768 | 19.0949 |
| 2 | 03690025 | 0.497742 | 2.60174e-05 | 18.9924 | 03690027 | 0.00190912 | 0.495859 | 19.0423 |
| 3 | 03690028 | 0.496362 | 0.00140601 | 18.9655 | 03690030 | 0.00266338 | 0.495105 | 18.9874 |