| Red | Green | Blue | |
| z | 17.64 | ||
| znorm | Inf | ||
| sky | -NaN | -NaN | -Inf |
| S/N | 28.2 | 46.3 | 51.0 |
| S/N(c) | 0.0 | 0.0 | 0.0 |
| SN(E/C) |
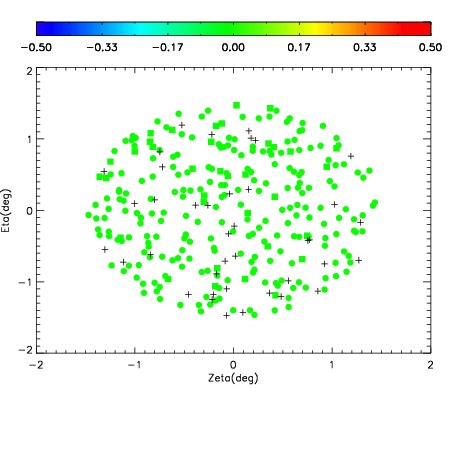
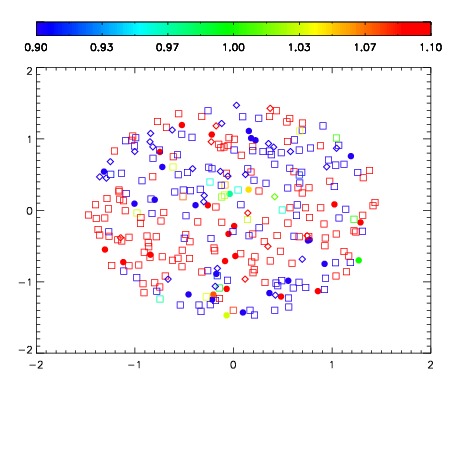
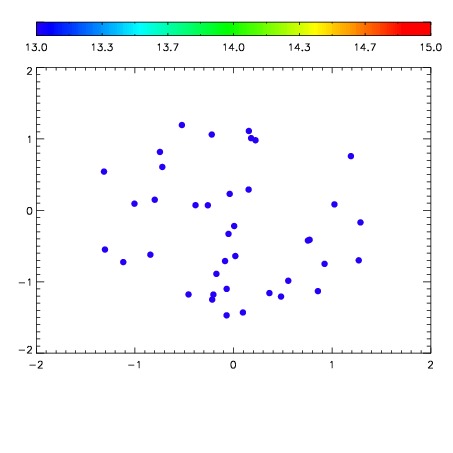

| Frame | Nreads | Zeropoints | Mag plots | Spatial mag deviation | Spatial sky 16325A emission deviations (filled: sky, open: star) | Spatial sky continuum emission | Spatial sky telluric CO2 absorption deviations (filled: H < 10) | |||||||||||||||||||||||
| 0 | 0 |
|
|
|
|
|
|
| IPAIR | NAME | SHIFT | NEWSHIFT | S/N | NAME | SHIFT | NEWSHIFT | S/N |
| 0 | 02870070 | 0.414504 | 0.00000 | 19.0884 | 02870071 | 0.00192024 | 0.412584 | 19.0951 |
| 1 | 02870069 | 0.413167 | 0.00133699 | 19.1259 | 02870068 | -0.000345949 | 0.414850 | 19.1026 |
| 2 | 02870066 | 0.413686 | 0.000817984 | 19.0269 | 02870067 | 0.00146819 | 0.413036 | 19.0617 |
| 3 | 02870065 | 0.412262 | 0.00224200 | 19.0173 | 02870064 | 0.00000 | 0.414504 | 18.9741 |