| Red | Green | Blue | |
| z | 17.63 | ||
| znorm | Inf | ||
| sky | -NaN | -NaN | -Inf |
| S/N | 30.6 | 54.7 | 58.4 |
| S/N(c) | 0.0 | 0.0 | 0.0 |
| SN(E/C) |
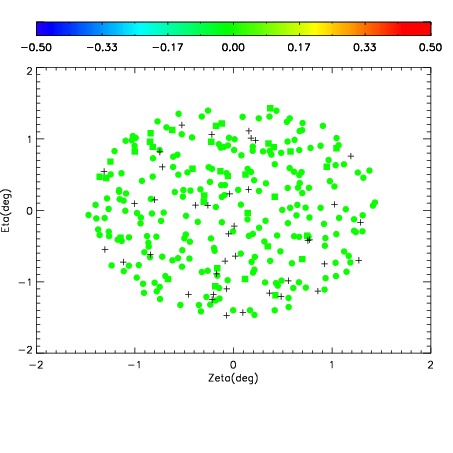
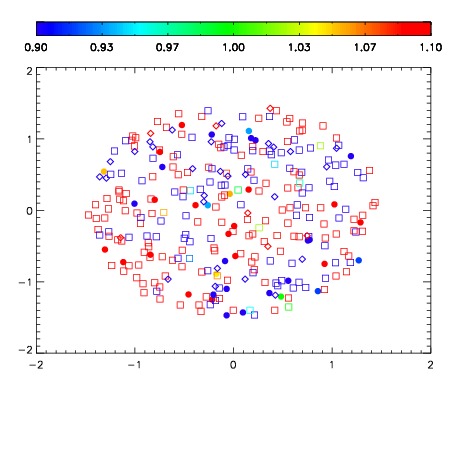


| Frame | Nreads | Zeropoints | Mag plots | Spatial mag deviation | Spatial sky 16325A emission deviations (filled: sky, open: star) | Spatial sky continuum emission | Spatial sky telluric CO2 absorption deviations (filled: H < 10) | |||||||||||||||||||||||
| 0 | 0 |
|
|
|
|
|
|
| IPAIR | NAME | SHIFT | NEWSHIFT | S/N | NAME | SHIFT | NEWSHIFT | S/N |
| 0 | 02910012 | 0.401130 | 0.00000 | 19.0992 | 02910010 | 0.00000 | 0.401130 | 19.0498 |
| 1 | 02910019 | 0.398228 | 0.00290200 | 19.2045 | 02910017 | -0.000161617 | 0.401292 | 19.2020 |
| 2 | 02910016 | 0.399805 | 0.00132498 | 19.1744 | 02910018 | -0.000961808 | 0.402092 | 19.1898 |
| 3 | 02910015 | 0.399605 | 0.00152498 | 19.1332 | 02910014 | -0.000505848 | 0.401636 | 19.1247 |
| 4 | 02910011 | 0.400214 | 0.000916004 | 19.1135 | 02910013 | 0.000822411 | 0.400308 | 19.0792 |