| Red | Green | Blue | |
| z | 17.63 | ||
| znorm | Inf | ||
| sky | -NaN | -NaN | -Inf |
| S/N | 22.7 | 38.0 | 41.1 |
| S/N(c) | 0.0 | 0.0 | 0.0 |
| SN(E/C) |
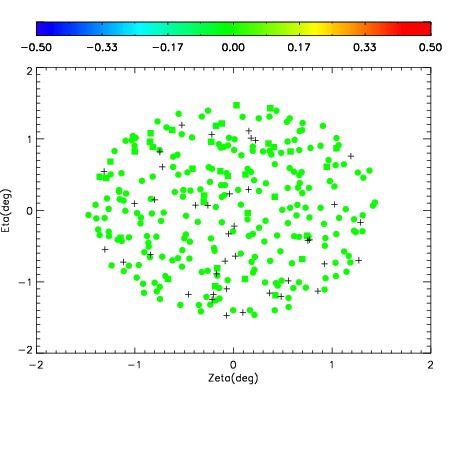
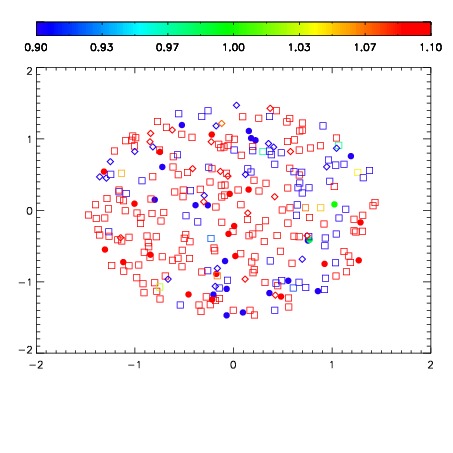
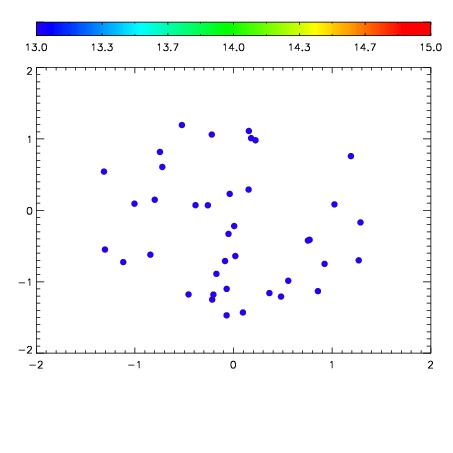

| Frame | Nreads | Zeropoints | Mag plots | Spatial mag deviation | Spatial sky 16325A emission deviations (filled: sky, open: star) | Spatial sky continuum emission | Spatial sky telluric CO2 absorption deviations (filled: H < 10) | |||||||||||||||||||||||
| 0 | 0 |
|
|
|
|
|
|
| IPAIR | NAME | SHIFT | NEWSHIFT | S/N | NAME | SHIFT | NEWSHIFT | S/N |
| 0 | 03960012 | 0.504731 | 0.00000 | 18.8706 | 03960013 | 0.00787824 | 0.496853 | 18.9494 |
| 1 | 03960011 | 0.504395 | 0.000335991 | 19.1002 | 03960010 | 0.00000 | 0.504731 | 19.0714 |
| 2 | 03960015 | 0.503201 | 0.00152999 | 18.6824 | 03960014 | 0.00794388 | 0.496787 | 18.8493 |
| 3 | 03960016 | 0.504569 | 0.000162005 | 17.9911 | 03960017 | 0.00444431 | 0.500287 | 17.9095 |