| Red | Green | Blue | |
| z | 17.64 | ||
| znorm | Inf | ||
| sky | -Inf | -Inf | -Inf |
| S/N | 27.2 | 47.3 | 50.2 |
| S/N(c) | 0.0 | 0.0 | 0.0 |
| SN(E/C) |
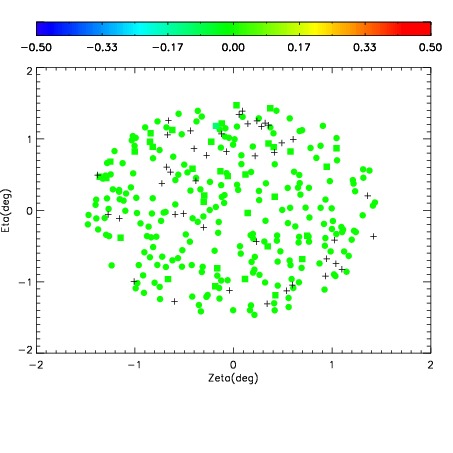
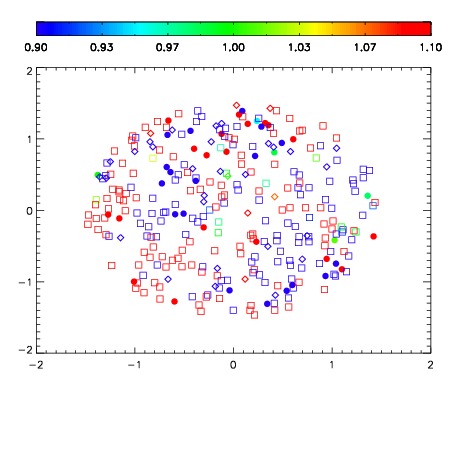
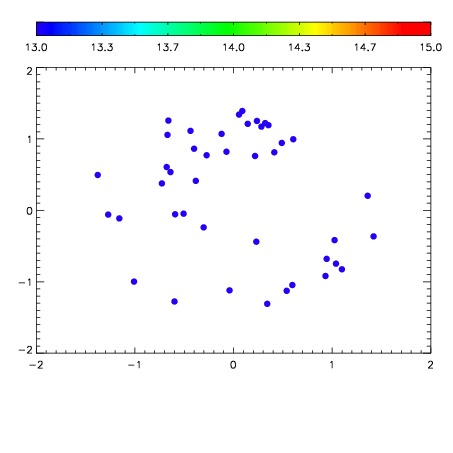

| Frame | Nreads | Zeropoints | Mag plots | Spatial mag deviation | Spatial sky 16325A emission deviations (filled: sky, open: star) | Spatial sky continuum emission | Spatial sky telluric CO2 absorption deviations (filled: H < 10) | |||||||||||||||||||||||
| 0 | 0 |
|
|
|
|
|
|
| IPAIR | NAME | SHIFT | NEWSHIFT | S/N | NAME | SHIFT | NEWSHIFT | S/N |
| 0 | 02860066 | 0.412706 | 0.00000 | 19.1432 | 02860071 | 0.00215244 | 0.410554 | 19.1343 |
| 1 | 02860070 | 0.410872 | 0.00183398 | 19.1479 | 02860067 | 0.000660517 | 0.412045 | 19.1435 |
| 2 | 02860069 | 0.409402 | 0.00330397 | 19.1369 | 02860068 | -0.00101425 | 0.413720 | 19.1245 |
| 3 | 02860065 | 0.411239 | 0.00146699 | 19.1270 | 02860064 | 0.00000 | 0.412706 | 19.1140 |