| Red | Green | Blue | |
| z | 17.64 | ||
| znorm | Inf | ||
| sky | -Inf | -NaN | -Inf |
| S/N | 26.1 | 44.9 | 47.0 |
| S/N(c) | 0.0 | 0.0 | 0.0 |
| SN(E/C) |
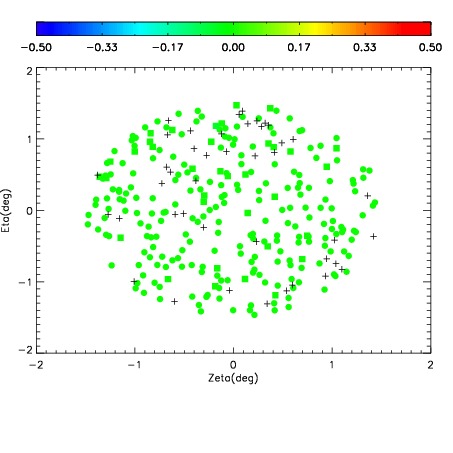
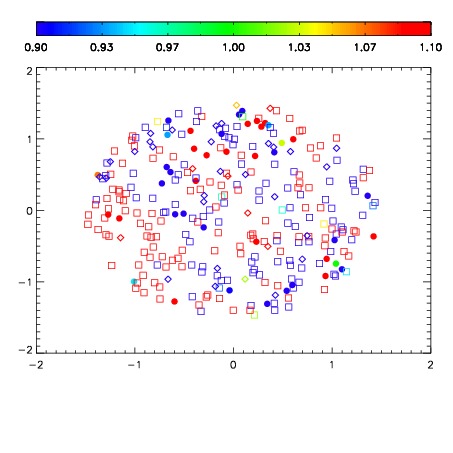


| Frame | Nreads | Zeropoints | Mag plots | Spatial mag deviation | Spatial sky 16325A emission deviations (filled: sky, open: star) | Spatial sky continuum emission | Spatial sky telluric CO2 absorption deviations (filled: H < 10) | |||||||||||||||||||||||
| 0 | 0 |
|
|
|
|
|
|
| IPAIR | NAME | SHIFT | NEWSHIFT | S/N | NAME | SHIFT | NEWSHIFT | S/N |
| 0 | 02900053 | 0.400648 | 0.00000 | 19.0665 | 02900050 | 0.00120639 | 0.399442 | 19.0227 |
| 1 | 02900049 | 0.400148 | 0.000499994 | 19.0963 | 02900047 | 0.00000 | 0.400648 | 19.0375 |
| 2 | 02900048 | 0.399230 | 0.00141799 | 19.0576 | 02900054 | 0.00222612 | 0.398422 | 19.0097 |
| 3 | 02900052 | 0.399001 | 0.00164700 | 19.0283 | 02900051 | -0.000239973 | 0.400888 | 18.9712 |