| Red | Green | Blue | |
| z | 17.64 | ||
| znorm | Inf | ||
| sky | -Inf | -Inf | -Inf |
| S/N | 29.5 | 50.4 | 54.6 |
| S/N(c) | 0.0 | 0.0 | 0.0 |
| SN(E/C) |
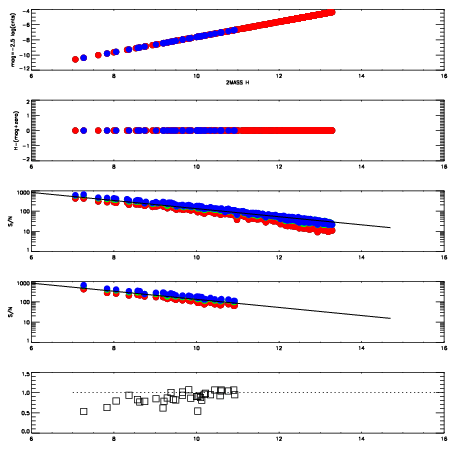
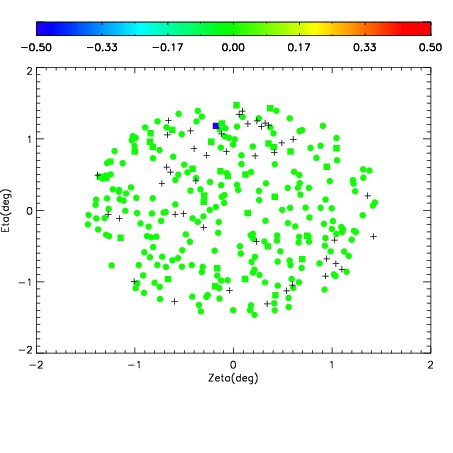
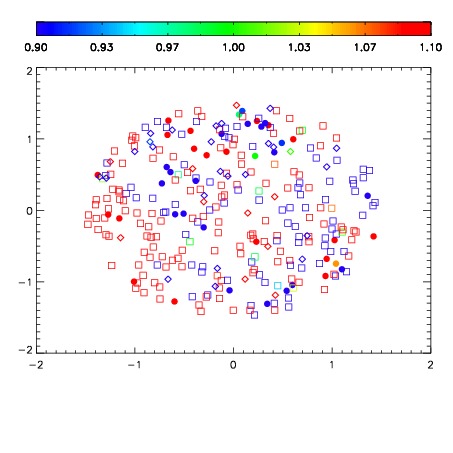
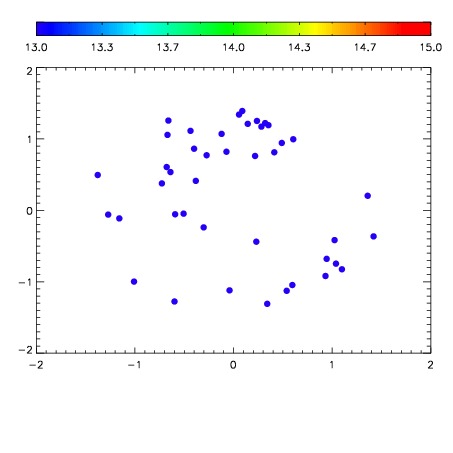

| Frame | Nreads | Zeropoints | Mag plots | Spatial mag deviation | Spatial sky 16325A emission deviations (filled: sky, open: star) | Spatial sky continuum emission | Spatial sky telluric CO2 absorption deviations (filled: H < 10) | |||||||||||||||||||||||
| 0 | 0 |
|
|
|
|
|
|
| IPAIR | NAME | SHIFT | NEWSHIFT | S/N | NAME | SHIFT | NEWSHIFT | S/N |
| 0 | 03970019 | 0.502625 | 0.00000 | 18.9324 | 03970013 | 4.43100e-05 | 0.502581 | 18.9222 |
| 1 | 03970016 | 0.501310 | 0.00131500 | 19.0900 | 03970010 | 0.00000 | 0.502625 | 19.0739 |
| 2 | 03970012 | 0.501842 | 0.000782967 | 19.0314 | 03970017 | 0.00228944 | 0.500336 | 19.0391 |
| 3 | 03970015 | 0.501270 | 0.00135499 | 18.9188 | 03970014 | 0.00121287 | 0.501412 | 18.8643 |
| 4 | 03970011 | 0.501569 | 0.00105602 | 18.8907 | 03970018 | 0.00288588 | 0.499739 | 18.8485 |