| Red | Green | Blue | |
| z | 17.64 | ||
| znorm | Inf | ||
| sky | -Inf | -Inf | -Inf |
| S/N | 24.4 | 41.9 | 45.7 |
| S/N(c) | 0.0 | 0.0 | 0.0 |
| SN(E/C) |
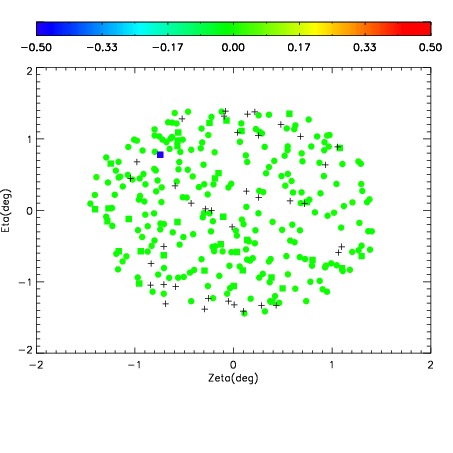
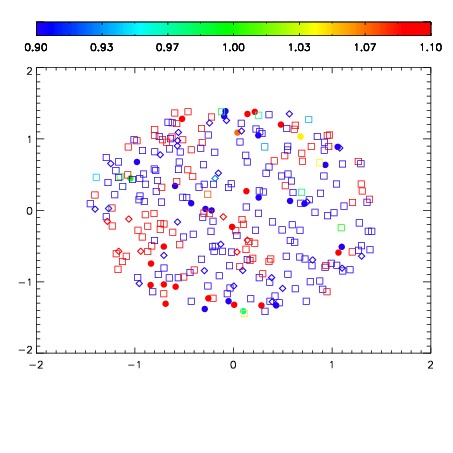


| Frame | Nreads | Zeropoints | Mag plots | Spatial mag deviation | Spatial sky 16325A emission deviations (filled: sky, open: star) | Spatial sky continuum emission | Spatial sky telluric CO2 absorption deviations (filled: H < 10) | |||||||||||||||||||||||
| 0 | 0 |
|
|
|
|
|
|
| IPAIR | NAME | SHIFT | NEWSHIFT | S/N | NAME | SHIFT | NEWSHIFT | S/N |
| 0 | 02620068 | 0.426896 | 0.00000 | 16.7371 | 02620066 | 0.00000 | 0.426896 | 17.9597 |
| 1 | 02620071 | 0.421302 | 0.00559402 | 19.0737 | 02620070 | -0.00110664 | 0.428003 | 18.9397 |
| 2 | 02620075 | 0.420438 | 0.00645801 | 18.9079 | 02620074 | -0.000150134 | 0.427046 | 18.9062 |
| 3 | 02620072 | 0.426045 | 0.000851005 | 18.9010 | 02620073 | 0.00152211 | 0.425374 | 18.8851 |
| 4 | 02620067 | 0.420135 | 0.00676101 | 18.2268 | 02620069 | 0.000842880 | 0.426053 | 18.8565 |