| Red | Green | Blue | |
| z | 17.64 | ||
| znorm | Inf | ||
| sky | -Inf | -Inf | -NaN |
| S/N | 25.4 | 45.9 | 50.0 |
| S/N(c) | 0.0 | 0.0 | 0.0 |
| SN(E/C) |


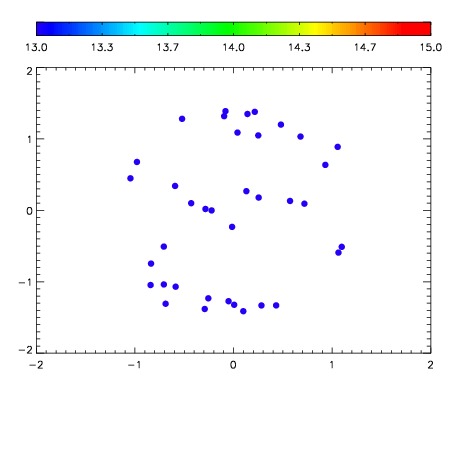

| Frame | Nreads | Zeropoints | Mag plots | Spatial mag deviation | Spatial sky 16325A emission deviations (filled: sky, open: star) | Spatial sky continuum emission | Spatial sky telluric CO2 absorption deviations (filled: H < 10) | |||||||||||||||||||||||
| 0 | 0 |
|
|
|
|
|
|
| IPAIR | NAME | SHIFT | NEWSHIFT | S/N | NAME | SHIFT | NEWSHIFT | S/N |
| 0 | 03210035 | 0.504424 | 0.00000 | 19.0204 | 03210033 | 0.000349020 | 0.504075 | 18.9934 |
| 1 | 03210030 | 0.501616 | 0.00280797 | 19.0406 | 03210036 | 0.00124907 | 0.503175 | 19.0867 |
| 2 | 03210034 | 0.501205 | 0.00321895 | 19.0276 | 03210032 | 0.00194918 | 0.502475 | 19.0160 |
| 3 | 03210031 | 0.503490 | 0.000934005 | 18.7952 | 03210029 | 0.00000 | 0.504424 | 18.8182 |