| Red | Green | Blue | |
| z | 17.64 | ||
| znorm | Inf | ||
| sky | -Inf | -Inf | -NaN |
| S/N | 18.8 | 31.5 | 34.9 |
| S/N(c) | 0.0 | 0.0 | 0.0 |
| SN(E/C) |
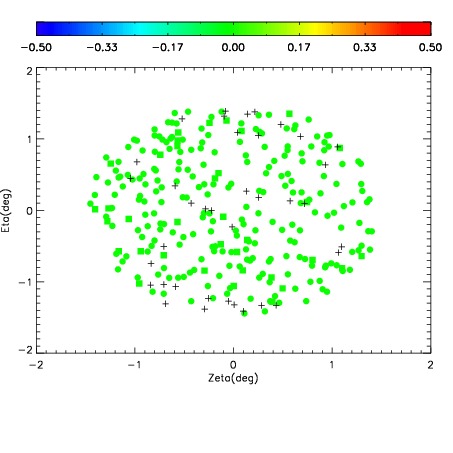
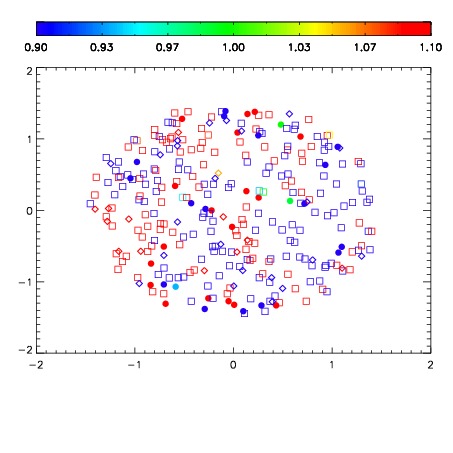
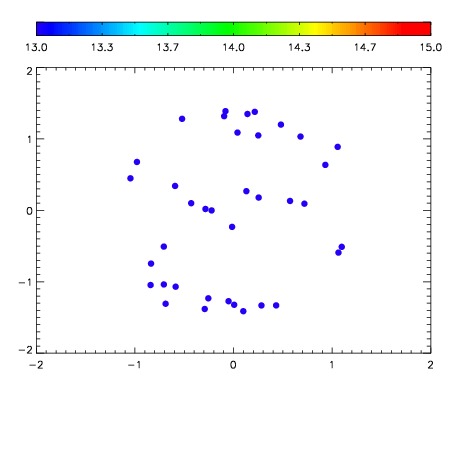

| Frame | Nreads | Zeropoints | Mag plots | Spatial mag deviation | Spatial sky 16325A emission deviations (filled: sky, open: star) | Spatial sky continuum emission | Spatial sky telluric CO2 absorption deviations (filled: H < 10) | |||||||||||||||||||||||
| 0 | 0 |
|
|
|
|
|
|
| IPAIR | NAME | SHIFT | NEWSHIFT | S/N | NAME | SHIFT | NEWSHIFT | S/N |
| 0 | 03420031 | 0.496426 | 0.00000 | 18.4539 | 03420028 | 0.00102517 | 0.495401 | 18.5721 |
| 1 | 03420026 | 0.491889 | 0.00453699 | 18.9379 | 03420025 | 0.00000 | 0.496426 | 18.7944 |
| 2 | 03420027 | 0.493975 | 0.00245097 | 18.7983 | 03420029 | 0.000379322 | 0.496047 | 18.6627 |
| 3 | 03420030 | 0.493929 | 0.00249699 | 18.6501 | 03420032 | 0.00277049 | 0.493656 | 18.5853 |