| Red | Green | Blue | |
| z | 17.64 | ||
| znorm | Inf | ||
| sky | -Inf | -Inf | -Inf |
| S/N | 28.8 | 50.2 | 51.6 |
| S/N(c) | 0.0 | 0.0 | 0.0 |
| SN(E/C) |
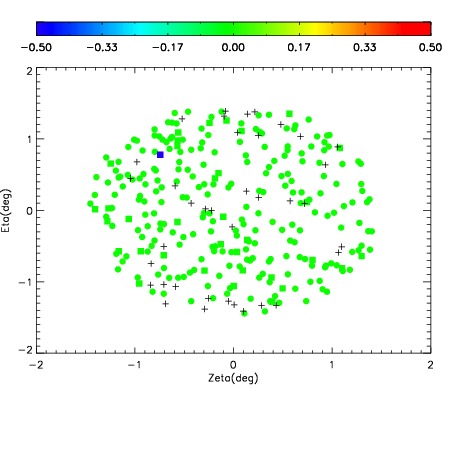
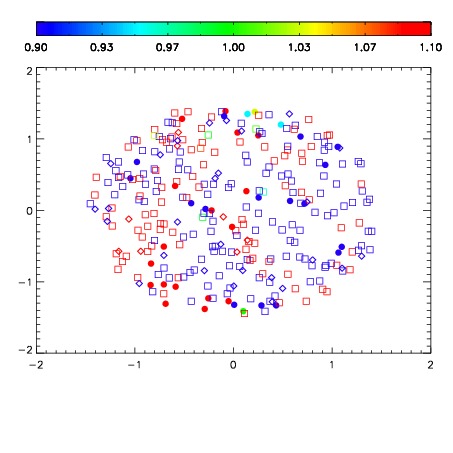
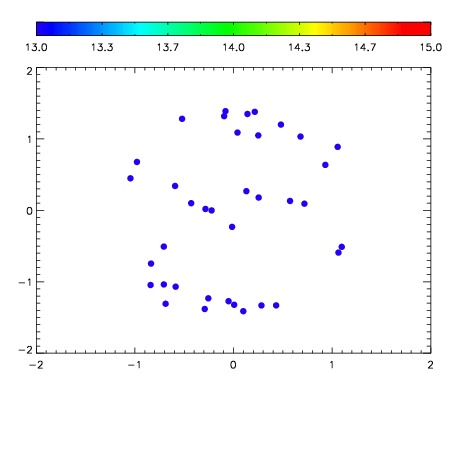

| Frame | Nreads | Zeropoints | Mag plots | Spatial mag deviation | Spatial sky 16325A emission deviations (filled: sky, open: star) | Spatial sky continuum emission | Spatial sky telluric CO2 absorption deviations (filled: H < 10) | |||||||||||||||||||||||
| 0 | 0 |
|
|
|
|
|
|
| IPAIR | NAME | SHIFT | NEWSHIFT | S/N | NAME | SHIFT | NEWSHIFT | S/N |
| 0 | 03430051 | 0.503188 | 0.00000 | 19.1066 | 03430052 | -0.000514769 | 0.503703 | 18.9936 |
| 1 | 03430046 | 0.501920 | 0.00126803 | 19.1366 | 03430045 | 0.00000 | 0.503188 | 19.1839 |
| 2 | 03430050 | 0.501436 | 0.00175202 | 19.1340 | 03430049 | -0.00103644 | 0.504224 | 19.1374 |
| 3 | 03430047 | 0.502461 | 0.000726998 | 19.1119 | 03430048 | -0.000268299 | 0.503456 | 19.0973 |