| Red | Green | Blue | |
| z | 17.64 | ||
| znorm | Inf | ||
| sky | -Inf | -Inf | -Inf |
| S/N | 14.2 | 26.7 | 27.7 |
| S/N(c) | 0.0 | 0.0 | 0.0 |
| SN(E/C) |
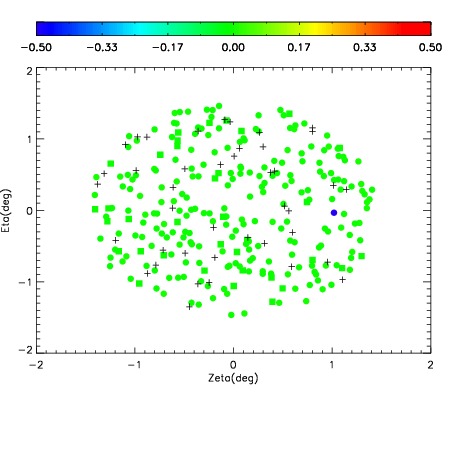

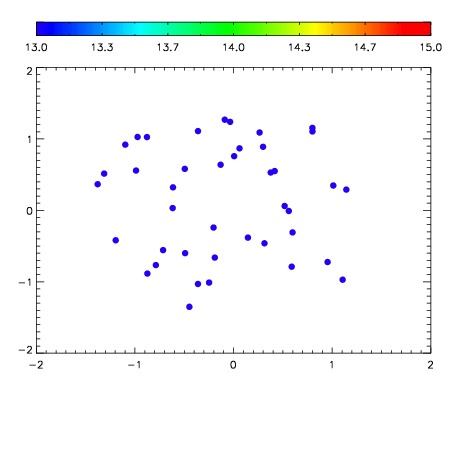

| Frame | Nreads | Zeropoints | Mag plots | Spatial mag deviation | Spatial sky 16325A emission deviations (filled: sky, open: star) | Spatial sky continuum emission | Spatial sky telluric CO2 absorption deviations (filled: H < 10) | |||||||||||||||||||||||
| 0 | 0 |
|
|
|
|
|
|
| IPAIR | NAME | SHIFT | NEWSHIFT | S/N | NAME | SHIFT | NEWSHIFT | S/N |
| 0 | 03220016 | 0.510103 | 0.00000 | 14.4122 | 03220017 | 0.00224982 | 0.507853 | 17.0240 |
| 1 | 03220011 | 0.507831 | 0.00227201 | 19.0098 | 03220010 | 0.00000 | 0.510103 | 18.5104 |
| 2 | 03220012 | 0.509312 | 0.000791013 | 18.9852 | 03220013 | 0.00204207 | 0.508061 | 17.9621 |
| 3 | 03220015 | 0.508260 | 0.00184298 | 17.6917 | 03220014 | 0.00102081 | 0.509082 | 17.9073 |