| Red | Green | Blue | |
| z | 17.64 | ||
| znorm | Inf | ||
| sky | -Inf | -Inf | -NaN |
| S/N | 23.9 | 43.5 | 45.2 |
| S/N(c) | 0.0 | 0.0 | 0.0 |
| SN(E/C) |
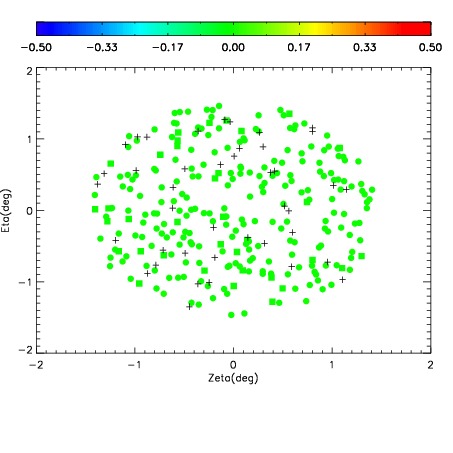
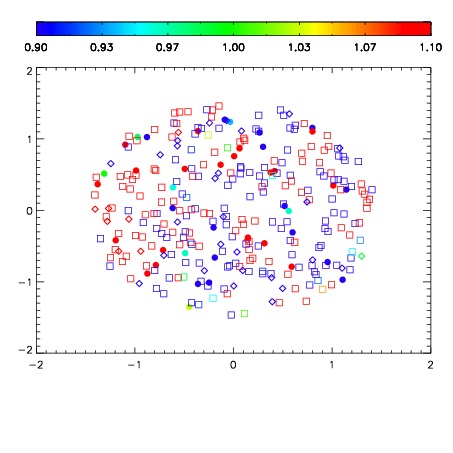
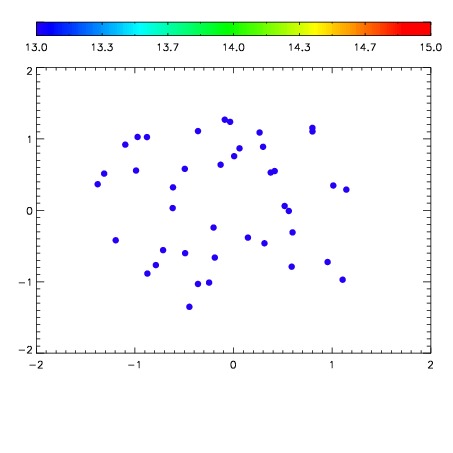

| Frame | Nreads | Zeropoints | Mag plots | Spatial mag deviation | Spatial sky 16325A emission deviations (filled: sky, open: star) | Spatial sky continuum emission | Spatial sky telluric CO2 absorption deviations (filled: H < 10) | |||||||||||||||||||||||
| 0 | 0 |
|
|
|
|
|
|
| IPAIR | NAME | SHIFT | NEWSHIFT | S/N | NAME | SHIFT | NEWSHIFT | S/N |
| 0 | 03480031 | 0.500374 | 0.00000 | 18.9527 | 03480028 | 0.00114121 | 0.499233 | 18.9574 |
| 1 | 03480026 | 0.498829 | 0.00154501 | 19.0521 | 03480025 | 0.00000 | 0.500374 | 19.0712 |
| 2 | 03480030 | 0.498992 | 0.00138202 | 19.0263 | 03480029 | 0.000617379 | 0.499757 | 19.0475 |
| 3 | 03480027 | 0.499827 | 0.000547022 | 18.7966 | 03480032 | 0.000581016 | 0.499793 | 18.9504 |