| Red | Green | Blue | |
| z | 17.64 | ||
| znorm | Inf | ||
| sky | -Inf | -Inf | -Inf |
| S/N | 31.1 | 55.9 | 58.3 |
| S/N(c) | 0.0 | 0.0 | 0.0 |
| SN(E/C) |
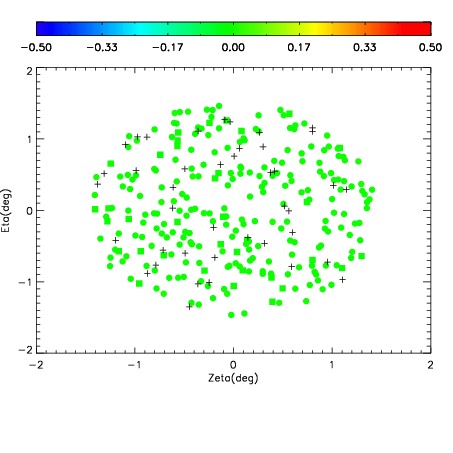
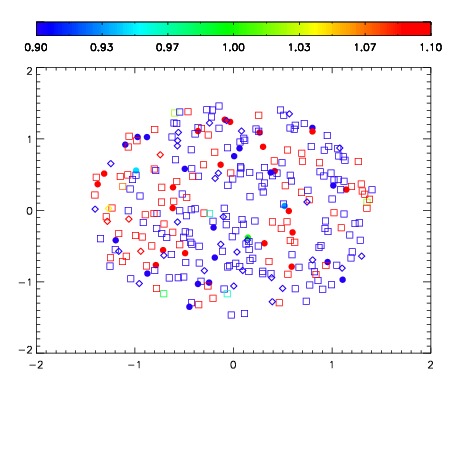


| Frame | Nreads | Zeropoints | Mag plots | Spatial mag deviation | Spatial sky 16325A emission deviations (filled: sky, open: star) | Spatial sky continuum emission | Spatial sky telluric CO2 absorption deviations (filled: H < 10) | |||||||||||||||||||||||
| 0 | 0 |
|
|
|
|
|
|
| IPAIR | NAME | SHIFT | NEWSHIFT | S/N | NAME | SHIFT | NEWSHIFT | S/N |
| 0 | 03640050 | 0.504477 | 0.00000 | 19.0877 | 03640052 | -0.000937245 | 0.505414 | 19.1003 |
| 1 | 03640045 | 0.500338 | 0.00413901 | 19.2080 | 03640047 | 0.000365443 | 0.504112 | 19.1782 |
| 2 | 03640046 | 0.502160 | 0.00231701 | 19.2066 | 03640044 | 0.00000 | 0.504477 | 19.1472 |
| 3 | 03640049 | 0.501446 | 0.00303102 | 19.1556 | 03640051 | 0.000188004 | 0.504289 | 19.1417 |
| 4 | 03640053 | 0.501180 | 0.00329703 | 19.1236 | 03640048 | -0.000828060 | 0.505305 | 19.1316 |