| Red | Green | Blue | |
| z | 17.64 | ||
| znorm | Inf | ||
| sky | -Inf | -Inf | -Inf |
| S/N | 29.0 | 50.5 | 55.2 |
| S/N(c) | 0.0 | 0.0 | 0.0 |
| SN(E/C) |
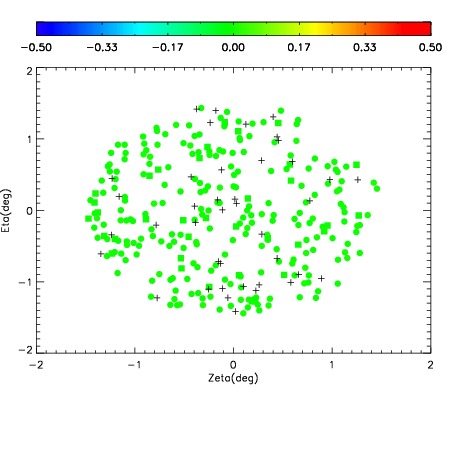
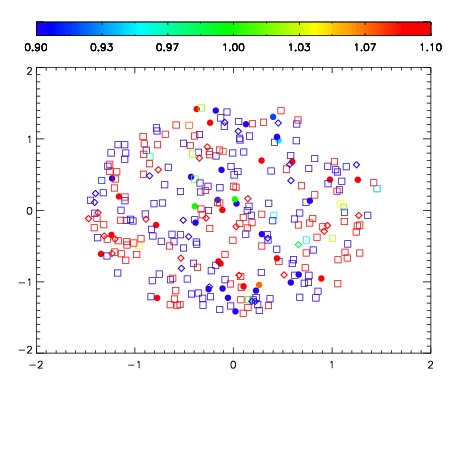
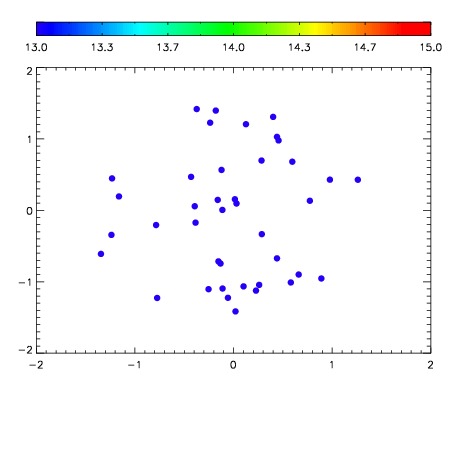

| Frame | Nreads | Zeropoints | Mag plots | Spatial mag deviation | Spatial sky 16325A emission deviations (filled: sky, open: star) | Spatial sky continuum emission | Spatial sky telluric CO2 absorption deviations (filled: H < 10) | |||||||||||||||||||||||
| 0 | 0 |
|
|
|
|
|
|
| IPAIR | NAME | SHIFT | NEWSHIFT | S/N | NAME | SHIFT | NEWSHIFT | S/N |
| 0 | 02630017 | 0.425238 | 0.00000 | 18.8717 | 02630019 | -0.00578905 | 0.431027 | 18.9174 |
| 1 | 02630020 | 0.419500 | 0.00573802 | 19.0777 | 02630022 | -0.00294764 | 0.428186 | 19.1047 |
| 2 | 02630024 | 0.413263 | 0.0119750 | 19.0517 | 02630023 | -0.00441485 | 0.429653 | 19.0746 |
| 3 | 02630021 | 0.422842 | 0.00239602 | 18.9534 | 02630015 | 0.00000 | 0.425238 | 19.0131 |
| 4 | 02630016 | 0.421230 | 0.00400802 | 18.8233 | 02630018 | -0.00179877 | 0.427037 | 18.8707 |