| Red | Green | Blue | |
| z | 17.64 | ||
| znorm | Inf | ||
| sky | -Inf | -Inf | -Inf |
| S/N | 26.6 | 47.0 | 49.2 |
| S/N(c) | 0.0 | 0.0 | 0.0 |
| SN(E/C) |
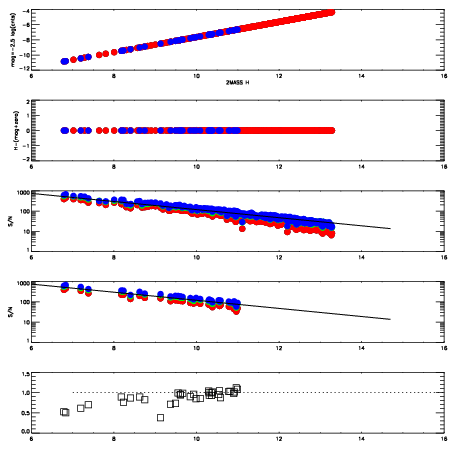
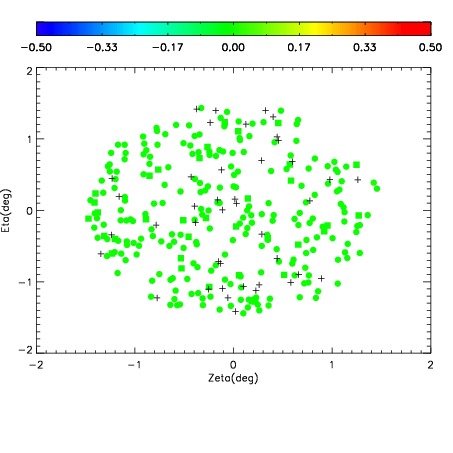
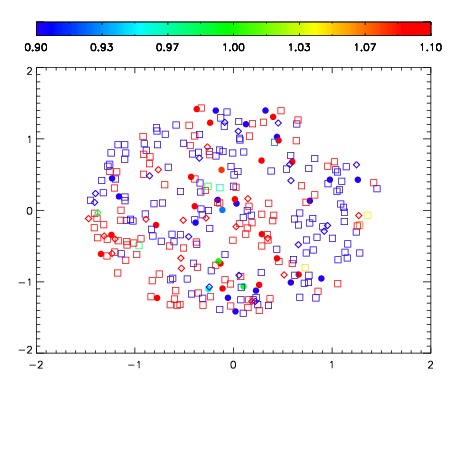
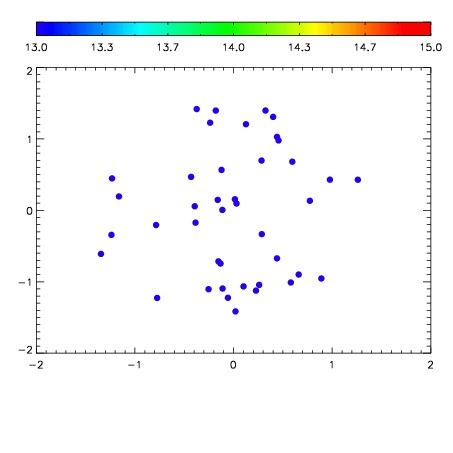

| Frame | Nreads | Zeropoints | Mag plots | Spatial mag deviation | Spatial sky 16325A emission deviations (filled: sky, open: star) | Spatial sky continuum emission | Spatial sky telluric CO2 absorption deviations (filled: H < 10) | |||||||||||||||||||||||
| 0 | 0 |
|
|
|
|
|
|
| IPAIR | NAME | SHIFT | NEWSHIFT | S/N | NAME | SHIFT | NEWSHIFT | S/N |
| 0 | 03180012 | 0.507156 | 0.00000 | 18.8487 | 03180017 | 0.00300037 | 0.504156 | 18.9024 |
| 1 | 03180016 | 0.502544 | 0.00461203 | 18.9648 | 03180013 | 0.00448193 | 0.502674 | 18.9315 |
| 2 | 03180015 | 0.500999 | 0.00615704 | 18.9370 | 03180014 | 0.00383644 | 0.503320 | 18.9281 |
| 3 | 03180011 | 0.505311 | 0.00184500 | 18.7903 | 03180010 | 0.00000 | 0.507156 | 18.7959 |