| Red | Green | Blue | |
| z | 17.64 | ||
| znorm | Inf | ||
| sky | -Inf | -Inf | -Inf |
| S/N | 20.6 | 34.9 | 38.7 |
| S/N(c) | 0.0 | 0.0 | 0.0 |
| SN(E/C) |
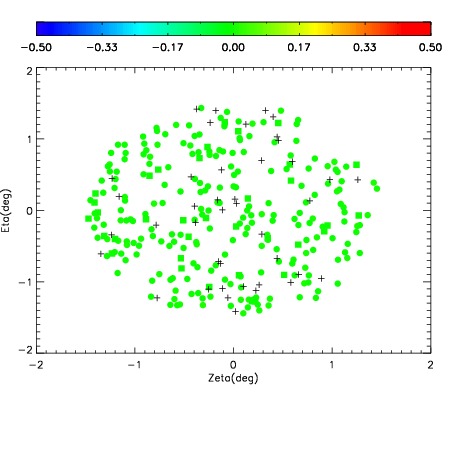
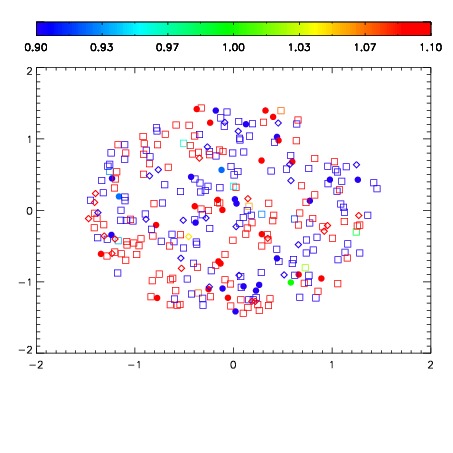
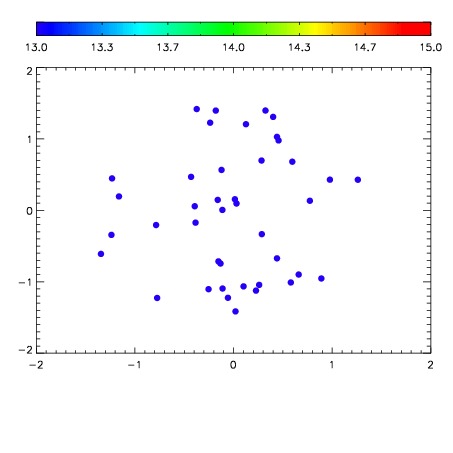

| Frame | Nreads | Zeropoints | Mag plots | Spatial mag deviation | Spatial sky 16325A emission deviations (filled: sky, open: star) | Spatial sky continuum emission | Spatial sky telluric CO2 absorption deviations (filled: H < 10) | |||||||||||||||||||||||
| 0 | 0 |
|
|
|
|
|
|
| IPAIR | NAME | SHIFT | NEWSHIFT | S/N | NAME | SHIFT | NEWSHIFT | S/N |
| 0 | 03340049 | 0.506020 | 0.00000 | 17.1511 | 03340047 | 0.00000 | 0.506020 | 18.5841 |
| 1 | 03340052 | 0.498020 | 0.00800002 | 19.0892 | 03340051 | -0.00112033 | 0.507140 | 18.9025 |
| 2 | 03340053 | 0.499149 | 0.00687101 | 18.5369 | 03340050 | 0.00239956 | 0.503620 | 18.8584 |
| 3 | 03340048 | 0.503083 | 0.00293702 | 18.0805 | 03340054 | 0.000212090 | 0.505808 | 18.7105 |