| Red | Green | Blue | |
| z | 17.64 | ||
| znorm | Inf | ||
| sky | -NaN | -NaN | -Inf |
| S/N | 27.2 | 47.2 | 51.5 |
| S/N(c) | 0.0 | 0.0 | 0.0 |
| SN(E/C) |

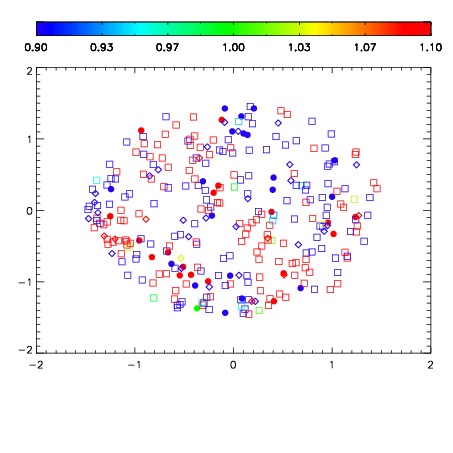
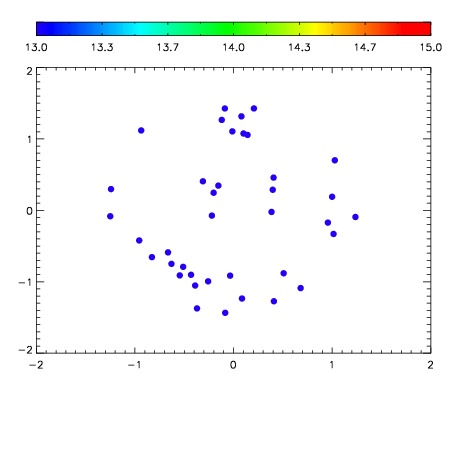

| Frame | Nreads | Zeropoints | Mag plots | Spatial mag deviation | Spatial sky 16325A emission deviations (filled: sky, open: star) | Spatial sky continuum emission | Spatial sky telluric CO2 absorption deviations (filled: H < 10) | |||||||||||||||||||||||
| 0 | 0 |
|
|
|
|
|
|
| IPAIR | NAME | SHIFT | NEWSHIFT | S/N | NAME | SHIFT | NEWSHIFT | S/N |
| 0 | 03410061 | 0.498983 | 0.00000 | 19.0933 | 03410066 | 0.00160662 | 0.497376 | 19.1052 |
| 1 | 03410060 | 0.496545 | 0.00243801 | 19.1864 | 03410059 | 0.00000 | 0.498983 | 19.1301 |
| 2 | 03410064 | 0.493964 | 0.00501901 | 19.0664 | 03410062 | -0.000673728 | 0.499657 | 19.0591 |
| 3 | 03410065 | 0.496664 | 0.00231901 | 19.0537 | 03410063 | -0.00106251 | 0.500045 | 19.0473 |