| Red | Green | Blue | |
| z | 17.64 | ||
| znorm | Inf | ||
| sky | -Inf | -Inf | -Inf |
| S/N | 15.3 | 26.7 | 29.2 |
| S/N(c) | 0.0 | 0.0 | 0.0 |
| SN(E/C) |
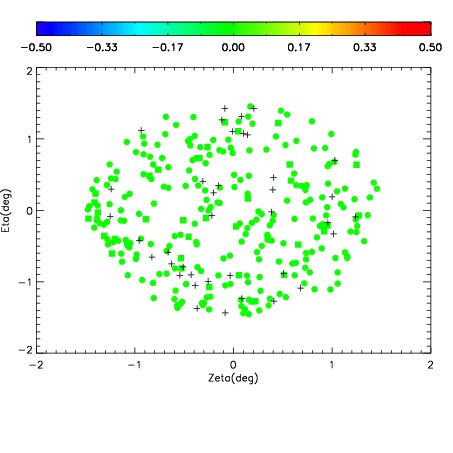
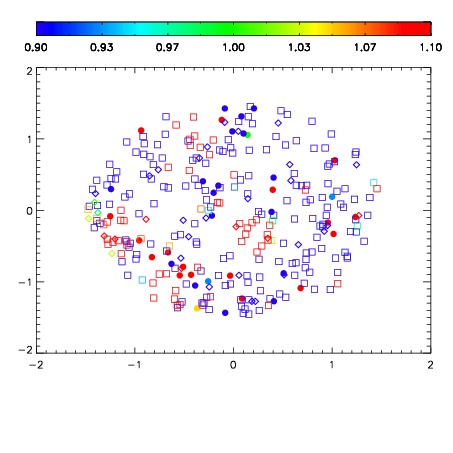
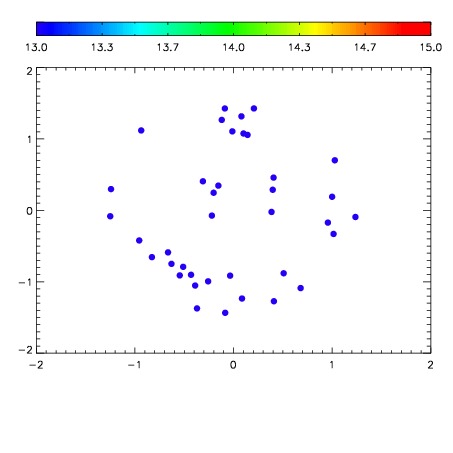

| Frame | Nreads | Zeropoints | Mag plots | Spatial mag deviation | Spatial sky 16325A emission deviations (filled: sky, open: star) | Spatial sky continuum emission | Spatial sky telluric CO2 absorption deviations (filled: H < 10) | |||||||||||||||||||||||
| 0 | 0 |
|
|
|
|
|
|
| IPAIR | NAME | SHIFT | NEWSHIFT | S/N | NAME | SHIFT | NEWSHIFT | S/N |
| 0 | 03480012 | 0.508824 | 0.00000 | 16.8172 | 03480010 | 0.00000 | 0.508824 | 17.0448 |
| 1 | 03480016 | 0.504101 | 0.00472301 | 19.0311 | 03480017 | 0.00174032 | 0.507084 | 19.0888 |
| 2 | 03480015 | 0.502863 | 0.00596100 | 17.7720 | 03480014 | -0.000126499 | 0.508950 | 17.9758 |
| 3 | 03480011 | 0.504885 | 0.00393897 | 17.4754 | 03480013 | 0.00192984 | 0.506894 | 17.4330 |