| Red | Green | Blue | |
| z | 17.64 | ||
| znorm | Inf | ||
| sky | -Inf | -Inf | -NaN |
| S/N | 17.8 | 30.9 | 33.4 |
| S/N(c) | 0.0 | 0.0 | 0.0 |
| SN(E/C) |


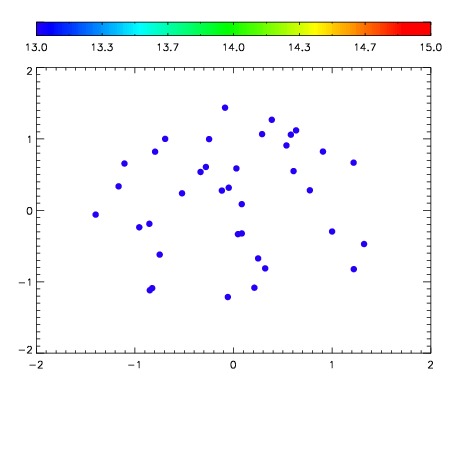

| Frame | Nreads | Zeropoints | Mag plots | Spatial mag deviation | Spatial sky 16325A emission deviations (filled: sky, open: star) | Spatial sky continuum emission | Spatial sky telluric CO2 absorption deviations (filled: H < 10) | |||||||||||||||||||||||
| 0 | 0 |
|
|
|
|
|
|
| IPAIR | NAME | SHIFT | NEWSHIFT | S/N | NAME | SHIFT | NEWSHIFT | S/N |
| 0 | 03490031 | 0.506287 | 0.00000 | 18.2418 | 03490032 | 0.00476329 | 0.501524 | 18.1273 |
| 1 | 03490026 | 0.505116 | 0.00117099 | 18.7830 | 03490025 | 0.00000 | 0.506287 | 18.7309 |
| 2 | 03490027 | 0.505677 | 0.000609994 | 18.7812 | 03490029 | -8.88236e-05 | 0.506376 | 18.2969 |
| 3 | 03490030 | 0.504523 | 0.00176400 | 18.1926 | 03490028 | -2.32782e-05 | 0.506310 | 18.0479 |