| Red | Green | Blue | |
| z | 17.64 | ||
| znorm | Inf | ||
| sky | -Inf | -Inf | -Inf |
| S/N | 32.5 | 53.0 | 57.8 |
| S/N(c) | 0.0 | 0.0 | 0.0 |
| SN(E/C) |
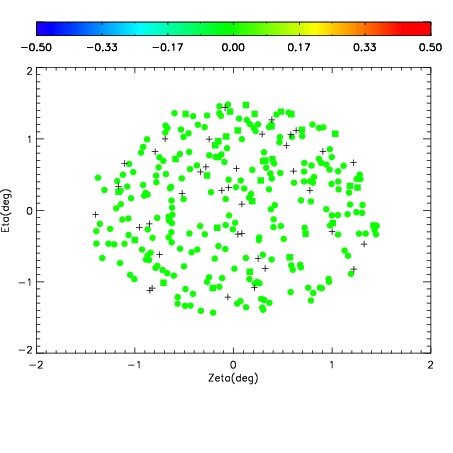
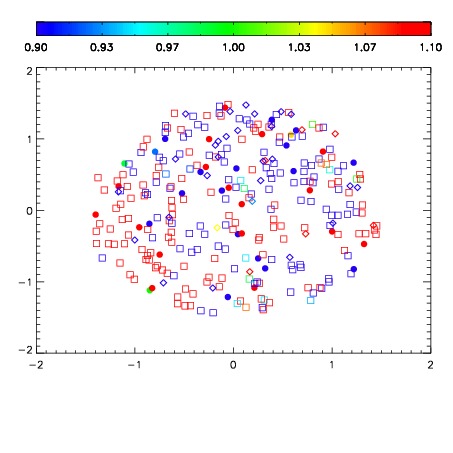
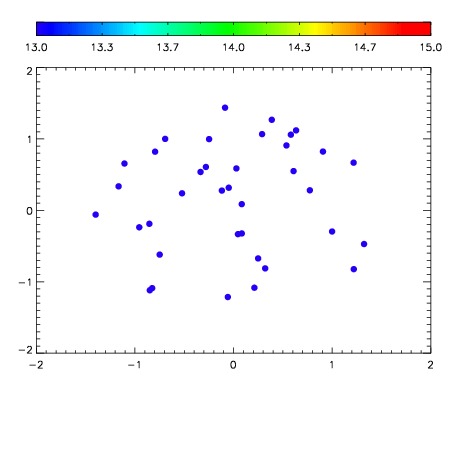

| Frame | Nreads | Zeropoints | Mag plots | Spatial mag deviation | Spatial sky 16325A emission deviations (filled: sky, open: star) | Spatial sky continuum emission | Spatial sky telluric CO2 absorption deviations (filled: H < 10) | |||||||||||||||||||||||
| 0 | 0 |
|
|
|
|
|
|
| IPAIR | NAME | SHIFT | NEWSHIFT | S/N | NAME | SHIFT | NEWSHIFT | S/N |
| 0 | 03700025 | 0.499140 | 0.00000 | 19.1366 | 03700034 | -0.00104190 | 0.500182 | 19.1027 |
| 1 | 03700024 | 0.494203 | 0.00493699 | 19.1169 | 03700026 | -0.00128722 | 0.500427 | 19.0780 |
| 2 | 03700029 | 0.495327 | 0.00381300 | 19.0378 | 03700023 | 0.00000 | 0.499140 | 19.0688 |
| 3 | 03700028 | 0.494275 | 0.00486499 | 19.0183 | 03700027 | -0.000789118 | 0.499929 | 19.0501 |
| 4 | 03700033 | 0.498989 | 0.000151008 | 18.9973 | 03700030 | -0.000201087 | 0.499341 | 19.0123 |
| 5 | 03700032 | 0.495608 | 0.00353199 | 18.9756 | 03700031 | -0.000316572 | 0.499457 | 18.9987 |